

Question: I need help with this spss problem, crosstabulation religious preference and allowing incurable patients to die 1. The following output is a crosstabulation of R's
I need help with this spss problem, crosstabulation religious preference and allowing incurable patients to die
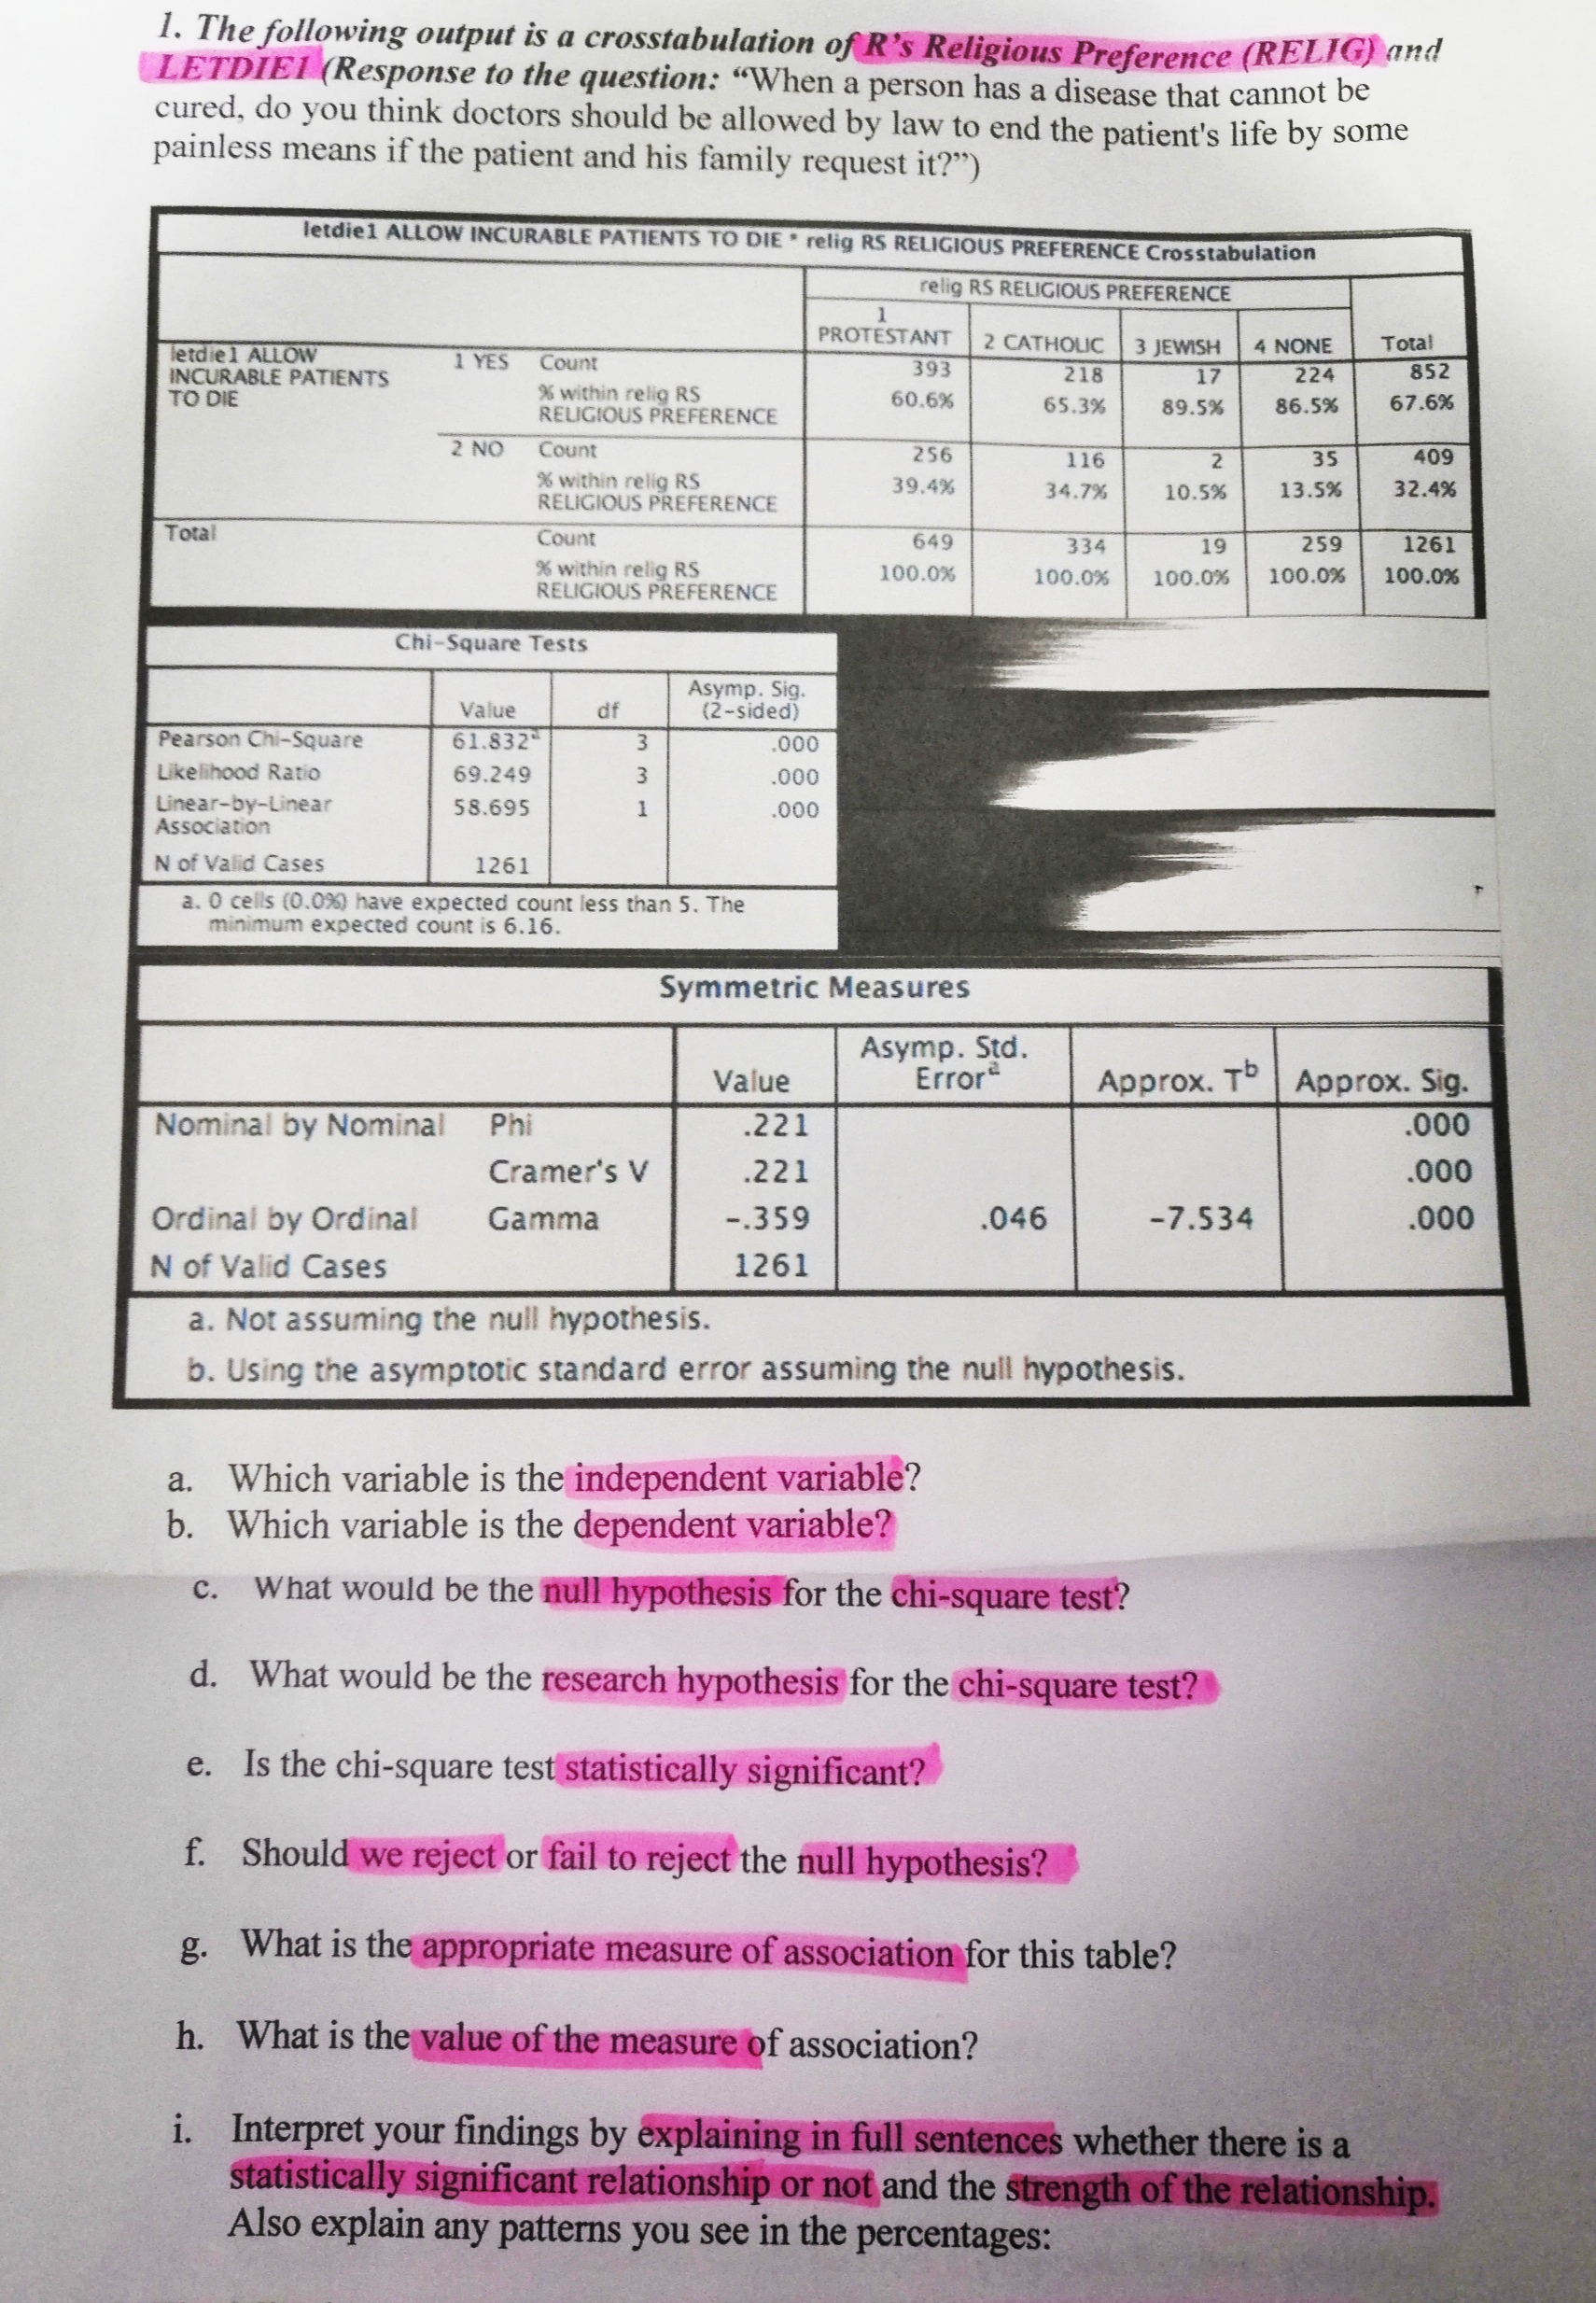
1. The following output is a crosstabulation of R's Religious Preference (RELIG) and LETDIEl (Response to the question: "When a person has a disease that cannot be cured, do you think doctors should be allowed by law to end the patient's life by some painless means if the patient and his family request it?") letdiel ALLOW INCURABLE PATIENTS TO DIE . relig RS RELIGIOUS PREFERENCE Crosstabulation relig RS RELIGIOUS PREFERENCE PROTESTANT letdie 1 ALLOW 2 CATHOLIC 3 JEWISH 4 NONE Total 1 YES INCURABLE PATIENTS Count 393 218 % within relig RS 17 224 852 TO DIE 60.6 RELIGIOUS PREFERENCE 65.3% 89.5% 86.5% 67.6% 2 NO Count 256 116 35 409 % within relig RS 39.4% RELIGIOUS PREFERENCE 34.7% 10.5% 13.5% 32.4% Total Count 549 334 19 259 1261 % within relig RS 100.0% RELIGIOUS PREFERENCE 100.0% 100.0% 100.0% 100.0% Chi-Square Tests Asymp. Sig. Value df (2-sided) Pearson Chi-Square 61.832 .000 Likelihood Ratio 69.249 000 Linear-by-Linear 58.695 000 Association N of Valid Cases 1261 a. 0 cells (0.0%) have expected count less than 5. The minimum expected count is 6.16. Symmetric Measures Asymp. Std. Value Error Approx. To Approx. Sig. Nominal by Nominal Phi .221 000 Cramer's V .221 .000 Ordinal by Ordinal Gamma -.359 .046 -7.534 .000 N of Valid Cases 1261 a. Not assuming the null hypothesis. b. Using the asymptotic standard error assuming the null hypothesis. a. Which variable is the independent variable? b. Which variable is the dependent variable? c. What would be the null hypothesis for the chi-square test? d. What would be the research hypothesis for the chi-square test? e. Is the chi-square test statistically significant? f. Should we reject or fail to reject the null hypothesis? g. What is the appropriate measure of association for this table? h. What is the value of the measure of association? i. Interpret your findings by explaining in full sentences whether there is a statistically significant relationship or not and the strength of the relationship. Also explain any patterns you see in the percentages
Step by Step Solution
There are 3 Steps involved in it

Get step-by-step solutions from verified subject matter experts