

Question: I need help with this stats problem. I got the first part with the correct values in rejection area. Any and all help would be
I need help with this stats problem. I got the first part with the correct values in rejection area. Any and all help would be greatly appreciated
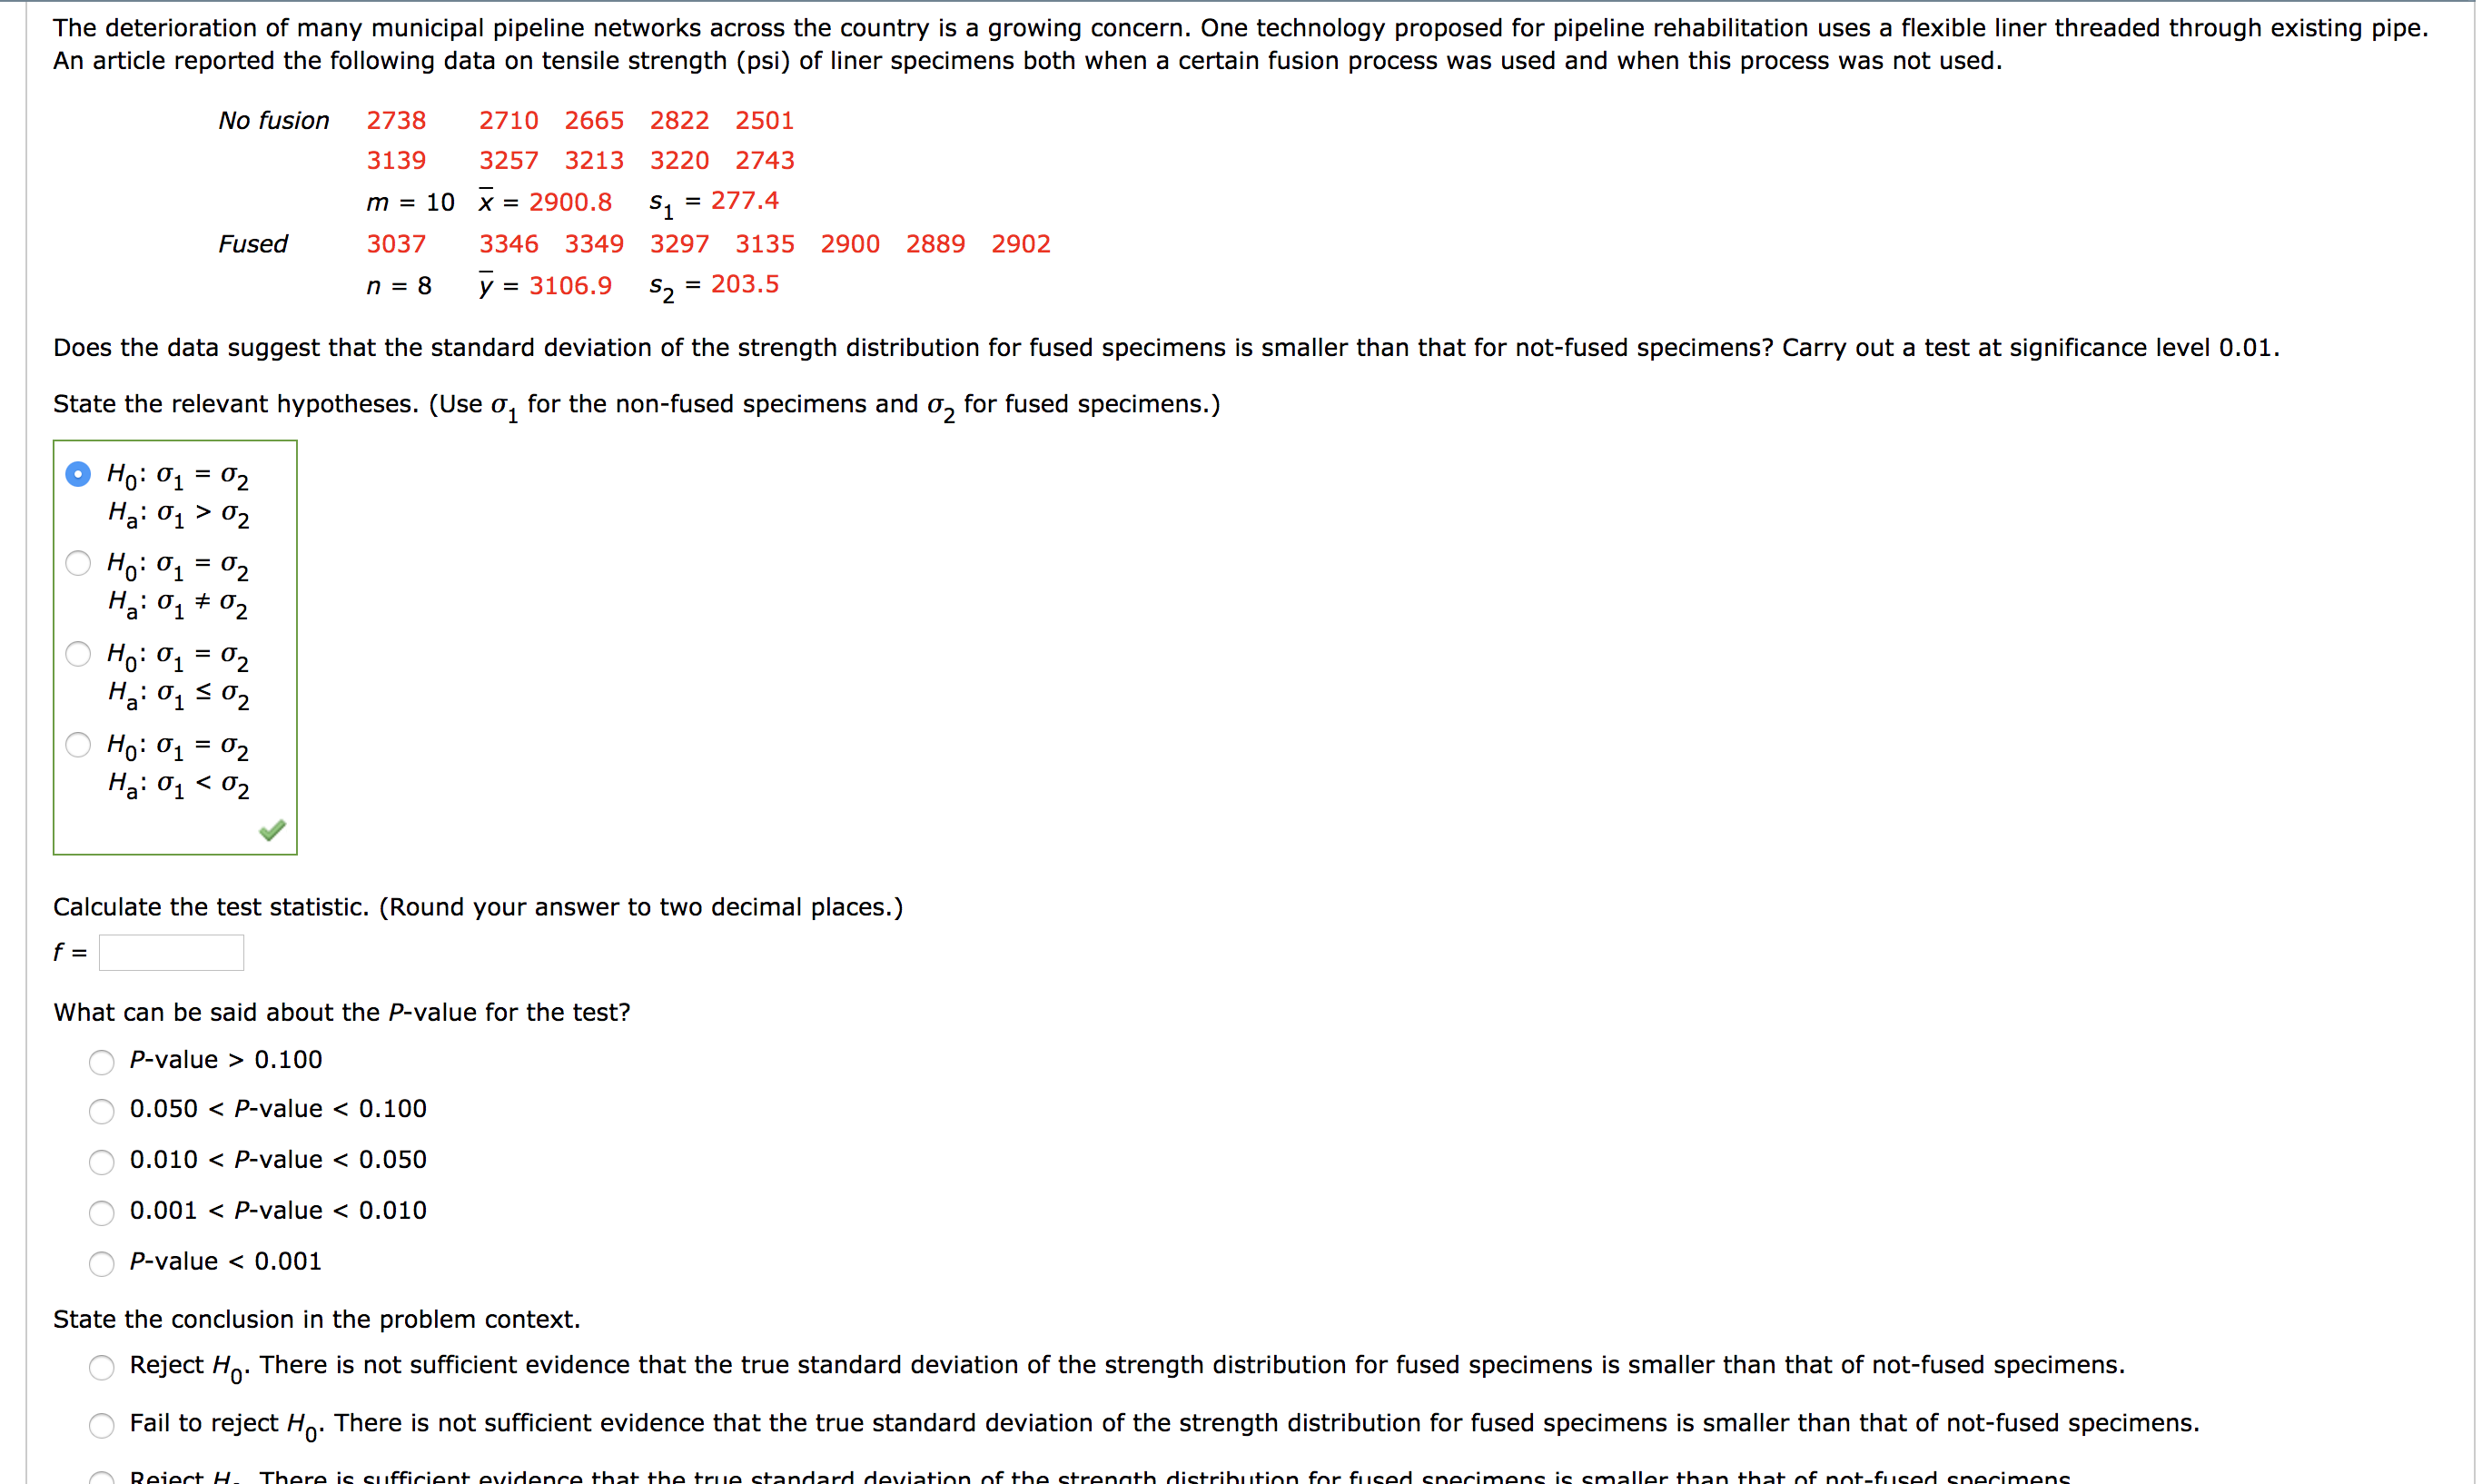
The deterioration of many municipal pipeline ne unicipal pipeline networks across the country is a grow rowing concern . One technology proposed for pipeline rehabilitation uses a flexible ses a flexible liner threaded through existing pipe An article reported th tensile strength ( psi ) of liner specimens both when e following data on tensile strength s both when a certain fusion process was used and when this process was not used No fusion 2738 2710 2665 2822 2501 3257 3213 3220 2743 m = 10 * = 2900.8 5 , = 277.4 3037 3346 3349 3297 3135 2900 2889 2902 Y = 3106.9 5 2 = 203. 5 Does the data suggest that the standard deviation of the strength distribution for Fused specimens is smaller than that for not -fused specimens ? Carry out a test at significance level D. 01 State the relevant hypotheses . ( Use o for the non-fused specimens and or , for fused specimens . ) Ho : = 02 1 2 02 10:0 1:0 0 1 5 0 2 Ho : 1 = 02 1 5 0 2 Calculate the test statistic . ( Round your answer to two decimal places . ) What can be said about the P -value for the test ? - Value > 0. 100 0.050 - P - value - 0 . 100 0 010
Step by Step Solution
There are 3 Steps involved in it

Get step-by-step solutions from verified subject matter experts