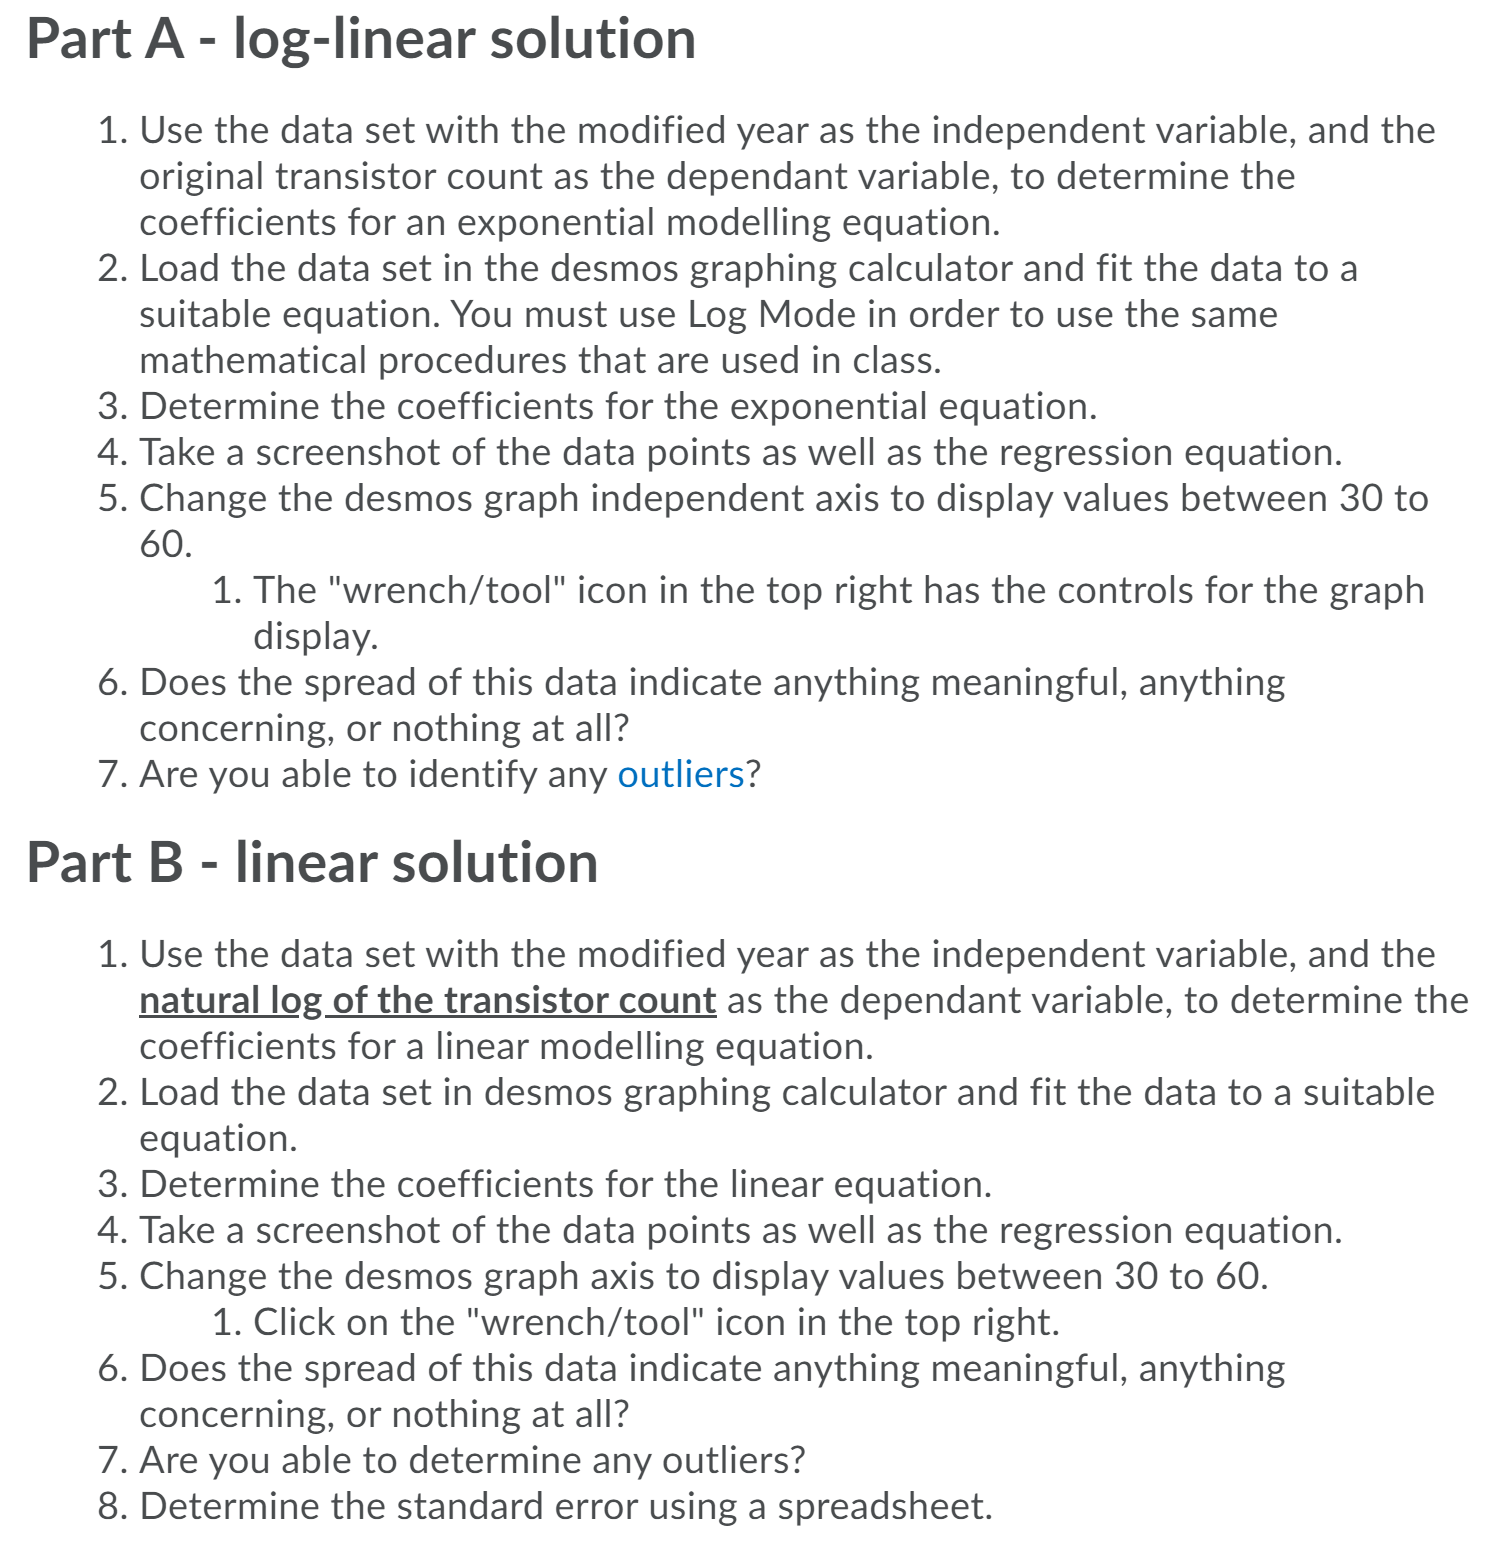
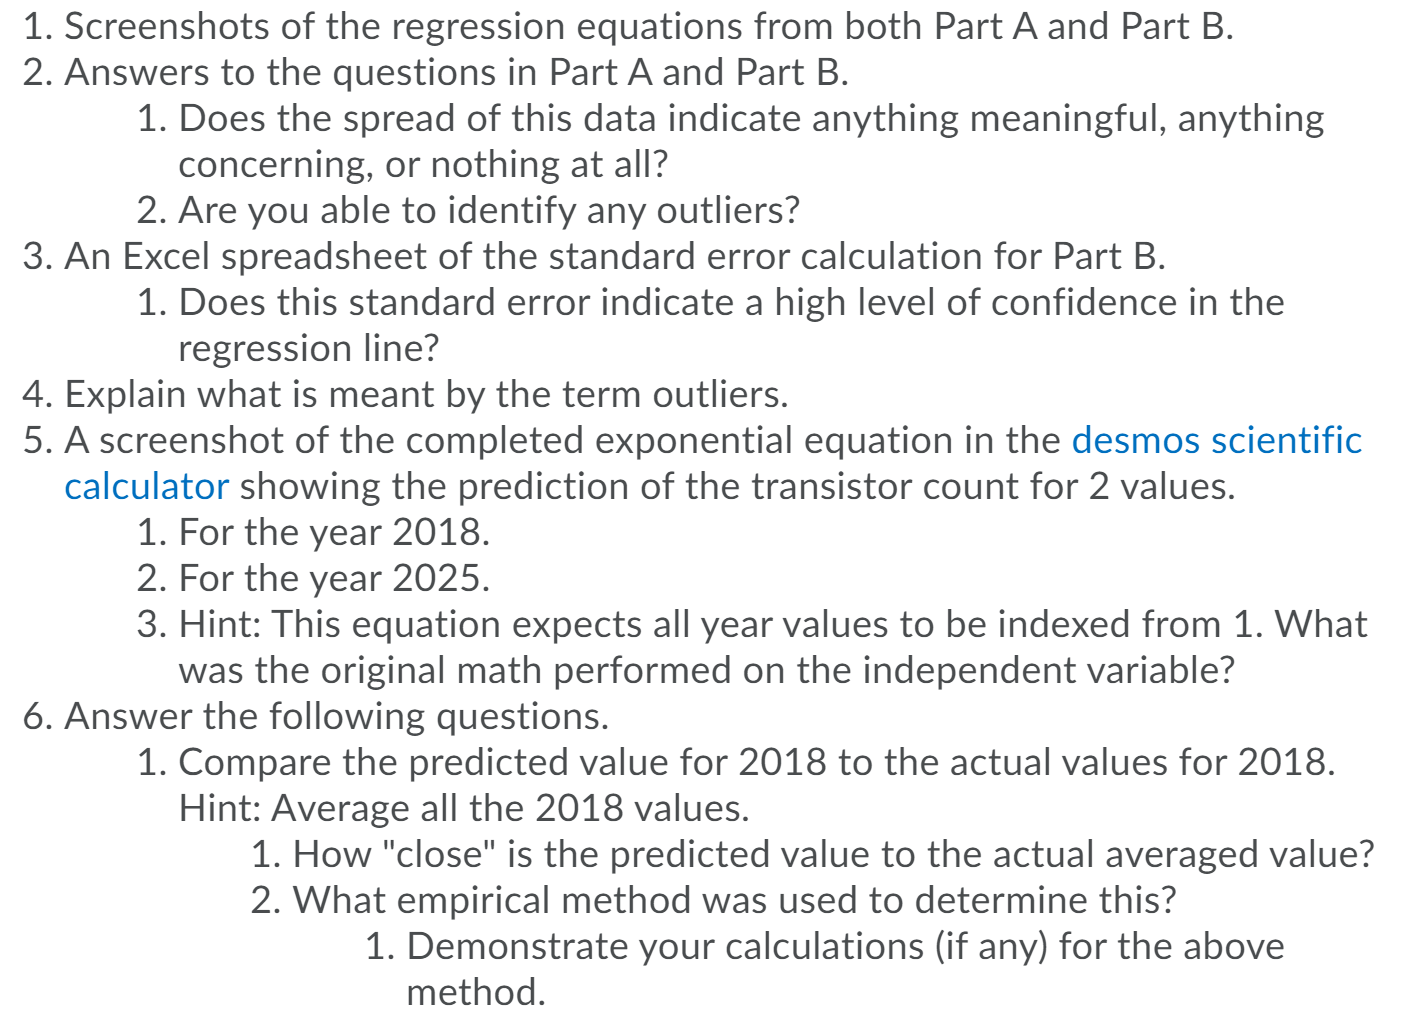
Question: i need help with this you find the data here: https://drive.google.com/drive/folders/1V6_cmut0udQHC9lXtnlqxwZVzmGOfWZW?usp=sharing Part A - log-linear solution 1. Use the data set with the modified year

i need help with this

you find the data here: https://drive.google.com/drive/folders/1V6_cmut0udQHC9lXtnlqxwZVzmGOfWZW?usp=sharing

i need help with this you find the data here:i need help with this you find the data here:
Part A - log-linear solution 1. Use the data set with the modified year as the independent variable, and the original transistor count as the dependant variable, to determine the coefficients for an exponential modelling equation. 2. Load the data set in the desmos graphing calculator and fit the data to a suitable equation. You must use Log Mode in order to use the same mathematical procedures that are used in class. 3. Determine the coefficients for the exponential equation. 4. Take a screenshot of the data points as well as the regression equation. 5. Change the desmos graph independent axis to display values between 30 to 60. 1. The \"wrench/tool" icon in the top right has the controls for the graph display. 6. Does the spread of this data indicate anything meaningful, anything concerning, or nothing at all? 7. Are you able to identify any outliers? Part B - linear solution 1. Use the data set with the modified year as the independent variable, and the natural log of the transistor count as the dependant variable, to determine the coefficients for a linear modelling equation. 2. Load the data set in desmos graphing calculator and fit the data to a suitable equaon. 3. Determine the coefficients for the linear equation. 4. Take a screenshot of the data points as well as the regression equation. 5. Change the desmos graph axis to display values between 30 to 60. 1. Click on the "wrench/tool" icon in the top right. 6. Does the spread of this data indicate anything meaningful, anything concerning, or nothing at all? 7. Are you able to determine any outliers? 8. Determine the standard error using a spreadsheet. 1. Screenshots of the regression equations from both Part A and Part B. 2. Answers to the questions in Part A and Part B. 1. Does the spread of this data indicate anything meaningful, anything concerning, or nothing at all? 2. Are you able to identify any outliers? 3. An Excel spreadsheet of the standard error calculation for Part B. 1. Does this standard error indicate a high level of confidence in the regression line? 4. Explain what is meant by the term outliers. 5. A screenshot of the completed exponential equation in the desmos scientific calculator showing the prediction of the transistor count for 2 values. 1. For the year 2018. 2. For the year 2025. 3. Hint: This equation expects all year values to be indexed from 1. What was the original math performed on the independent variable? 6. Answer the following questions. 1. Compare the predicted value for 2018 to the actual values for 2018. Hint: Average all the 2018 values. 1. How "close" is the predicted value to the actual averaged value? 2. What empirical method was used to determine this? 1. Demonstrate your calculations (if any) for the above method

Step by Step Solution

There are 3 Steps involved in it

1 Expert Approved Answer
Step: 1 Unlock blur-text-image
Question Has Been Solved by an Expert!

Get step-by-step solutions from verified subject matter experts

Step: 2 Unlock
Step: 3 Unlock

Students Have Also Explored These Related Mathematics Questions!