

Question: I need help with understanding this pairwise comparison output graph (attached as files below): 3. An experiment was conducted to compare the energy requirements for
I need help with understanding this pairwise comparison output graph (attached as files below):
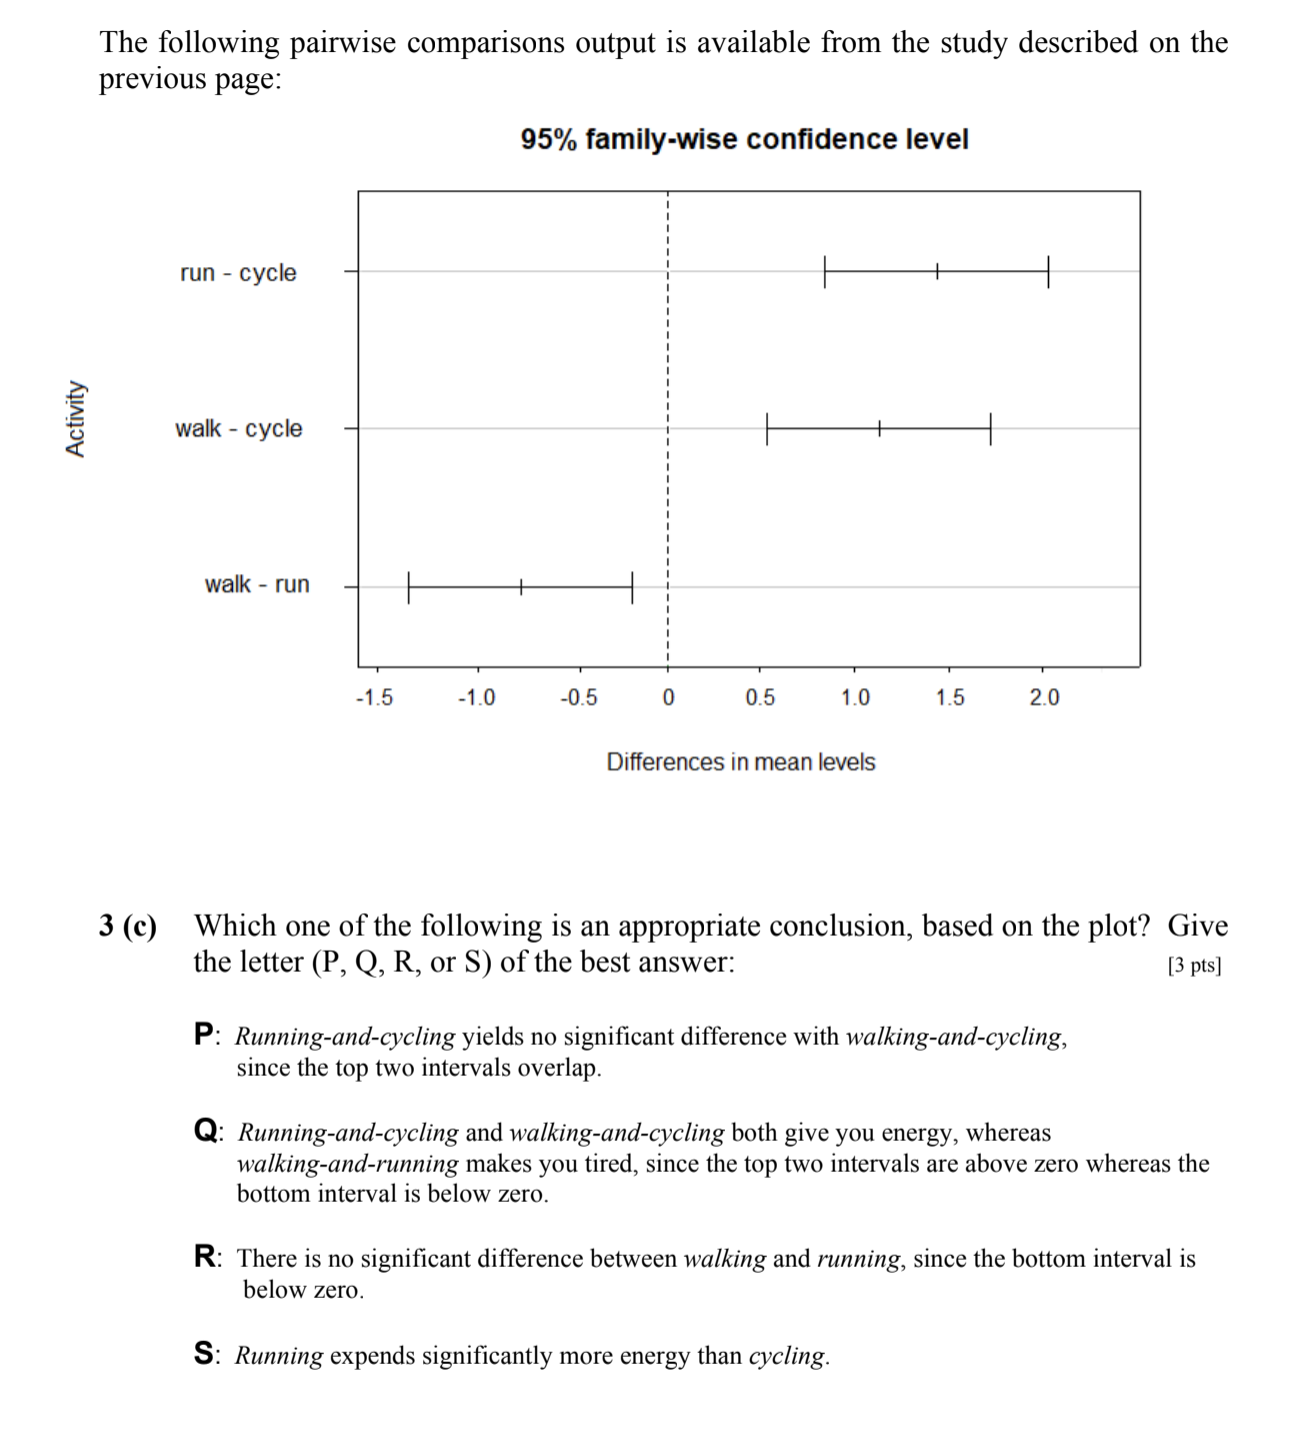
3. An experiment was conducted to compare the energy requirements for three physical activities: Running, walking, and bicycling. A random sample of subjects participated in the study, and each subject was randomly assigned to do one of three Activities: To either Run, Walk, or Bicycle (each for a specied distance in kilometers), and then the energy expended (in kilocalories per kilometer) is determined for each subject during each activity. The following pairwise comparisons output is available from the study described on the previous page: 95% family-wise confidence level run - cycle Activity walk - cycle walk - run -1.5 -1.0 -0.5 0 0.5 1.0 1.5 2.0 Differences in mean levels 3 (c) Which one of the following is an appropriate conclusion, based on the plot? Give the letter (P, Q, R, or S) of the best answer: [3 pts] P: Running-and-cycling yields no significant difference with walking-and-cycling, since the top two intervals overlap. Q: Running-and-cycling and walking-and-cycling both give you energy, whereas walking-and-running makes you tired, since the top two intervals are above zero whereas the bottom interval is below zero. R: There is no significant difference between walking and running, since the bottom interval is below zero. S: Running expends significantly more energy than cycling
Step by Step Solution
There are 3 Steps involved in it

Get step-by-step solutions from verified subject matter experts