

Question: I need help writing the python code for the following three questions based on the output from above: 1) Create a visual of your choice
I need help writing the python code for the following three questions based on the output from above:
1) Create a visual of your choice to display ExportTons for every Year for five ports: Baltimore, MD, Wilmington, DE, Jacksonville, FL, New Orleans, LA and West Palm Beach, FL.
2) Make sure your visual has a title and both an x and y axis label.
Some options for the visual maps are heatmaps or seaborn pair plot.
3) In a markdown cell, explain what your visual tells you about Jacksonville, FL between 2000 and 2017.
See attachment:
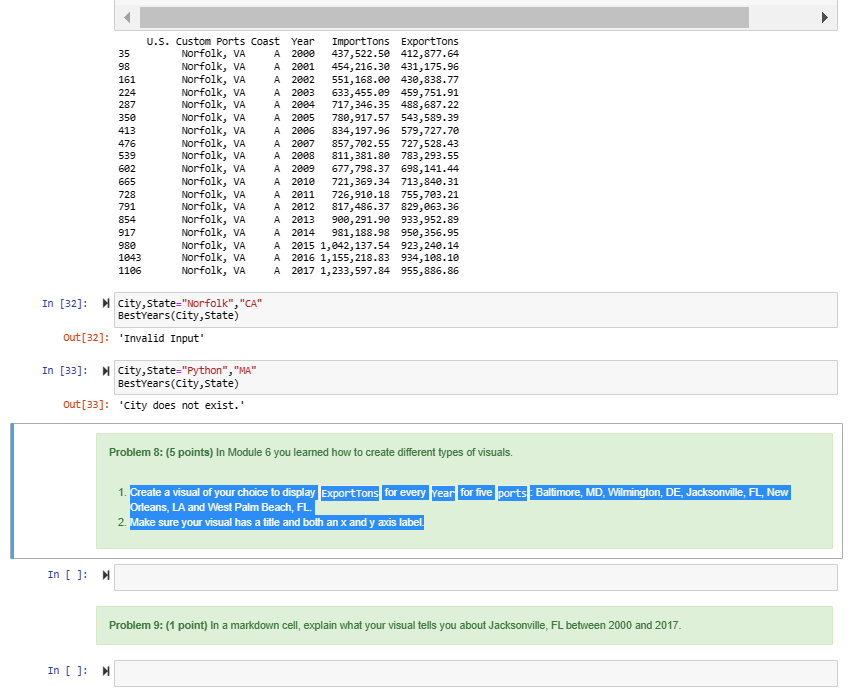
Problem 8: (5 points) In Module 6 you learned how to create different types of visuals. 1. Create a visual of your choice to display : Baltimore, MD, Wilmington, DE, Orleans, LA and West Palm Beach, FL. 2. Make sure your visual has a title and both an x and y axis label. Problem 9: (1 point) In a markdown cell, explain what your visual tells you about Jacksonville, FL between 2000 and 2017
Step by Step Solution
There are 3 Steps involved in it

Get step-by-step solutions from verified subject matter experts