

Question: I need helpncompleying steps 2-5 this may help? To complete 1. Open the workbook named CKG.xlsx located in the Chapter 1 folder, and then save
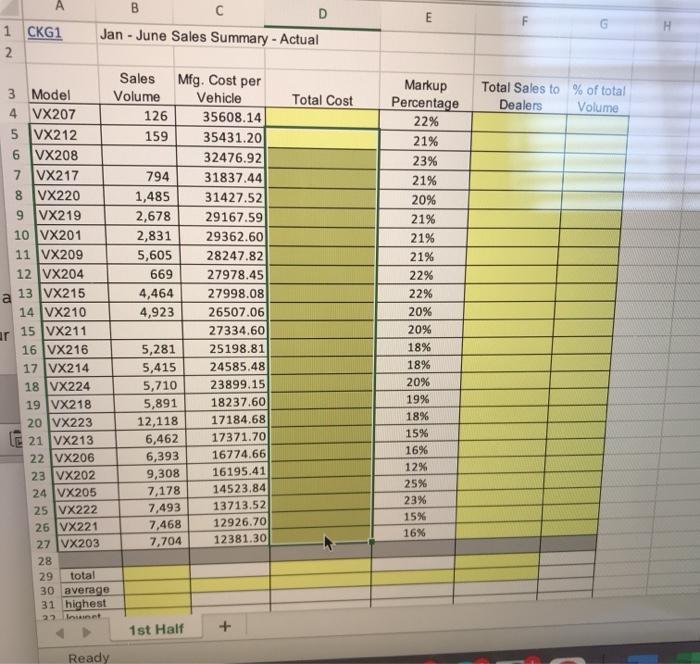
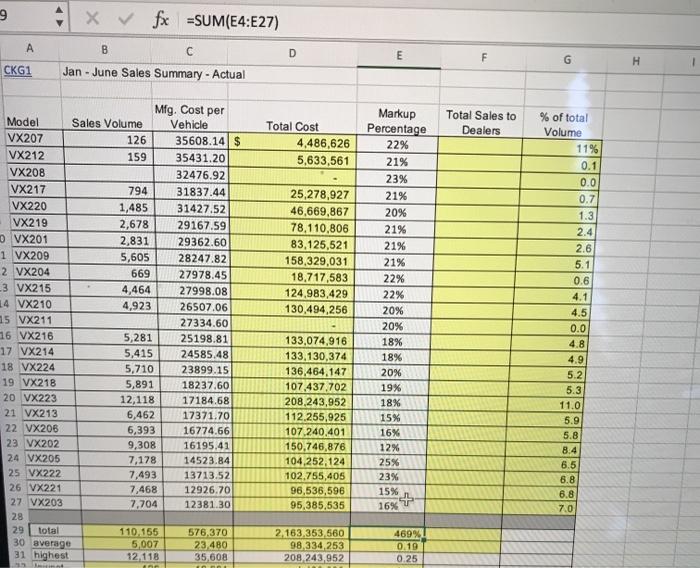
To complete 1. Open the workbook named CKG.xlsx located in the Chapter 1 folder, and then save the file as CKG Sales.xlsx. Rename the Sheetl worksheet tab as 1st Half. 2. In the highlighted cells, enter formulas to perform the necessary calculations for January through June and to summarize. Be sure to write all formulas so that they can be copied as necessary. Note the following: Display all dollar values in whole numbers and include the dollar sign in the first row and total rows only. When calculating averages, your formula should automatically exclude models that had no sales. Display all average values (other than the percentage) with commas and no decimal places. When calculating summary data (total, average, etc.), keep in mind that additional car models (rows) may eventually be inserted at the bottom of the list. The formulas in column G need to determine the percent of total volume sales that the vehicle represents. That is, if model A sold 100 cars and a total of 1000 cars were sold for all models, then model A would represent 10% of the total volume.) Format the cells in column G to display values to the nearest tenth of a percent. Be sure to calculate the number of models available for sale. 3. Your next task is to estimate the July through December sales based on the marketing data and the sales volume for the second half of the year. The marketing group has provided a list of all car models in identical order to the original data you received with the expected sales volumes for each car model. You can find this list in the Market.xlsx workbook, located in the Chapter 1 folder. The marketing group assumes that the manufacturing costs and markups will be the same for the second half of the year as they were for the first half. With the data and assumptions in mind, insert a new worksheet named 2nd Half in the CKG Sales.xlsx workbook, identical to the 1st Half worksheet. Copy and paste the sales volumes from the Market.xlsx workbook into your new worksheet. Verify that all the calculations in the new work sheet reflect the new data. 1 Applying Fundamental Excel Skills and Tools in Problem Solving Chapter 1 TROUBLESHOOTING: In order to complete this task successfully, copy the entire Ist Half worksheet to a new worksheet. Then, copy only the values for the sales volume, excluding the heading, from the Market workbook by highlighting the column values and clicking the Copy button. Next, place the insertion point in the cell of the new worksheet corresponding to the first vehicle's volume, and then paste the data. Check the calculated fields (Total Cost, Total Sales to Dealers, etc.) to make sure vehicles that were not sold during the first half of the year have values calculated and vehicles not sold during the second half do not have values, 4. Add another new worksheet named Summary, and include the column headings shown in Table 1.9 on this new worksheet. Chapter Exercises Table 1.9: Column headings for Summary worksheet Model Annual Jon-June July-Dec Total Sales Total Volume Sales to Sales to to Dealers Sales to Dealers Dealers Dealers Jan-June % Total Soles to Dealers July-Dec Total Sales to Dealers Annual a. Insert the model numbers in the identical format as shown on the 1st Half and 2nd Half worksheets. b. Insert the annual volume for each modelthe combined totals of the January through June and the July through December volumes. Make sure that the values will automatically update if any of the input values are changed. 6. Insert the Jan-June sales to dealers, again ensuring that these values will automatically update if any of the input data changes. d. Insert the July-Dec sales to dealers, again ensuring that these values will automatically update if any of the input data changes. e. Create a combined total of sales to dealers for the entire year. f. Calculate the total volumes and the total sales to dealers for each time period and annually in a row below the data. g. Calculate the percentage of sales to dealers that each model represents, as a per- centage of the total sales to dealers for all models, for January through June, July through December, and the year. Use only one formula for this calculation, and make sure that the formula can be copied down the column to calculate the percentages for the corresponding models and across the row to calculate the percentages for the corresponding time frames. Display the percentages with an appropriate format and number of decimal places 5. Format all three worksheets so that they have a professional appearance. 6. Save and close the CKG Sales.xlsx workbook. 77 E 1 CKG1 2 B D Jan - June Sales Summary - Actual Total Cost Total Sales to % of total Dealers Volume 3 Model 4 VX207 5 VX212 6 VX208 7 VX217 8 VX220 9 VX219 10 VX201 11 VX209 12 VX204 a 13 VX215 14 VX210 15 VX211 16 VX216 17 | VX214 18 VX224 19 VX218 20 VX223 21 VX213 22 VX206 23 VX202 24 VX205 25 VX222 26 VX221 27 VX203 28 Sales Mfg. Cost per Volume Vehicle 126 35608.14 159 35431.20 32476.92 794 31837.44 1,485 31427.52 2,678 29167.59 2,831 29362.60 5,605 28247.82 669 27978.45 4,464 27998.08 4,923 26507.06 27334.60 5,281 25198.81 5,415 24585.48 5,710 23899.15 5,891 18237.60 12,118 17184.68 6,462 17371.70 6,393 16774.66 9,308 16195.41 7,178 14523.84 7,493 13713.52 7,468 12926.70 7,704 12381.30 Markup Percentage 22% 21% 23% 21% 20% 21% 21% 21% 22% 22% 20% 20% 18% 18% 20% 19% 18% 15% 16% 12% 25% 23% 15% 16% ar 29 total 30 average 31 highest 22 Inst 1st Half + Ready C 9 fx =SUM(E4:E27) A B C D E H 1 CKG1 Jan - June Sales Summary - Actual Total Sales to Dealers Total Cost 4,486,626 5,633,561 25,278,927 46,669,867 78,110,806 83,125,521 158,329,031 18.717,583 124,983,429 130,494,256 Mfg. Cost per Model Sales Volume Vehicle VX207 126 35608.14 $ VX212 159 35431.20 VX208 32476.92 VX217 794 31837.44 VX220 1,485 31427.52 VX219 2,678 29167.59 0 VX201 2,831 29362.60 1 VX209 5,605 28247.82 2 VX204 669 27978.45 3 VX215 4,464 27998.08 14 VX210 4,923 26507.06 15 VX211 27334.60 16 VX216 5,281 25198.81 17 VX214 5,415 24585.48 18 VX224 5,710 23899.15 19 VX218 5,891 18237.60 20 VX223 12,118 17184.68 21 VX213 6,462 17371.70 22 VX206 6,393 16774.66 23 VX202 9,308 16195.41 24 VX205 7,178 14523.84 25 VX222 7,493 13713.52 26 VX221 7,468 12926.70 27 VX203 7.704 12381.30 28 29 total 110.155 576,370 30 average 5,007 23480 31 highest 12.118 35,608 Markup Percentage 22% 21% 23% 21% 20% 21% 21% 21% 22% 22% 20% 20% 18% 18% 20% 19% 18% 15% 16% 12% 25% 23% 15% + 16% % of total Volume 11% 0.1 0.0 0.7 1.3 2.4 2.6 5.1 0.6 4.1 4.5 0.0 4.8 4.9 5.2 5.3 11.0 5.9 5.8 8.4 6.5 6.8 6.8 7.0 133,074,916 133,130,374 136,464.147 107,437,702 208,243,952 112,255,925 107 240,401 150.746,876 104,252,124 102.755,405 96,536,596 95,385,535 2.163,353 560 98,334,253 208 243,952 469% 0.19 0.25 To complete 1. Open the workbook named CKG.xlsx located in the Chapter 1 folder, and then save the file as CKG Sales.xlsx. Rename the Sheetl worksheet tab as 1st Half. 2. In the highlighted cells, enter formulas to perform the necessary calculations for January through June and to summarize. Be sure to write all formulas so that they can be copied as necessary. Note the following: Display all dollar values in whole numbers and include the dollar sign in the first row and total rows only. When calculating averages, your formula should automatically exclude models that had no sales. Display all average values (other than the percentage) with commas and no decimal places. When calculating summary data (total, average, etc.), keep in mind that additional car models (rows) may eventually be inserted at the bottom of the list. The formulas in column G need to determine the percent of total volume sales that the vehicle represents. That is, if model A sold 100 cars and a total of 1000 cars were sold for all models, then model A would represent 10% of the total volume.) Format the cells in column G to display values to the nearest tenth of a percent. Be sure to calculate the number of models available for sale. 3. Your next task is to estimate the July through December sales based on the marketing data and the sales volume for the second half of the year. The marketing group has provided a list of all car models in identical order to the original data you received with the expected sales volumes for each car model. You can find this list in the Market.xlsx workbook, located in the Chapter 1 folder. The marketing group assumes that the manufacturing costs and markups will be the same for the second half of the year as they were for the first half. With the data and assumptions in mind, insert a new worksheet named 2nd Half in the CKG Sales.xlsx workbook, identical to the 1st Half worksheet. Copy and paste the sales volumes from the Market.xlsx workbook into your new worksheet. Verify that all the calculations in the new work sheet reflect the new data. 1 Applying Fundamental Excel Skills and Tools in Problem Solving Chapter 1 TROUBLESHOOTING: In order to complete this task successfully, copy the entire Ist Half worksheet to a new worksheet. Then, copy only the values for the sales volume, excluding the heading, from the Market workbook by highlighting the column values and clicking the Copy button. Next, place the insertion point in the cell of the new worksheet corresponding to the first vehicle's volume, and then paste the data. Check the calculated fields (Total Cost, Total Sales to Dealers, etc.) to make sure vehicles that were not sold during the first half of the year have values calculated and vehicles not sold during the second half do not have values, 4. Add another new worksheet named Summary, and include the column headings shown in Table 1.9 on this new worksheet. Chapter Exercises Table 1.9: Column headings for Summary worksheet Model Annual Jon-June July-Dec Total Sales Total Volume Sales to Sales to to Dealers Sales to Dealers Dealers Dealers Jan-June % Total Soles to Dealers July-Dec Total Sales to Dealers Annual a. Insert the model numbers in the identical format as shown on the 1st Half and 2nd Half worksheets. b. Insert the annual volume for each modelthe combined totals of the January through June and the July through December volumes. Make sure that the values will automatically update if any of the input values are changed. 6. Insert the Jan-June sales to dealers, again ensuring that these values will automatically update if any of the input data changes. d. Insert the July-Dec sales to dealers, again ensuring that these values will automatically update if any of the input data changes. e. Create a combined total of sales to dealers for the entire year. f. Calculate the total volumes and the total sales to dealers for each time period and annually in a row below the data. g. Calculate the percentage of sales to dealers that each model represents, as a per- centage of the total sales to dealers for all models, for January through June, July through December, and the year. Use only one formula for this calculation, and make sure that the formula can be copied down the column to calculate the percentages for the corresponding models and across the row to calculate the percentages for the corresponding time frames. Display the percentages with an appropriate format and number of decimal places 5. Format all three worksheets so that they have a professional appearance. 6. Save and close the CKG Sales.xlsx workbook. 77 E 1 CKG1 2 B D Jan - June Sales Summary - Actual Total Cost Total Sales to % of total Dealers Volume 3 Model 4 VX207 5 VX212 6 VX208 7 VX217 8 VX220 9 VX219 10 VX201 11 VX209 12 VX204 a 13 VX215 14 VX210 15 VX211 16 VX216 17 | VX214 18 VX224 19 VX218 20 VX223 21 VX213 22 VX206 23 VX202 24 VX205 25 VX222 26 VX221 27 VX203 28 Sales Mfg. Cost per Volume Vehicle 126 35608.14 159 35431.20 32476.92 794 31837.44 1,485 31427.52 2,678 29167.59 2,831 29362.60 5,605 28247.82 669 27978.45 4,464 27998.08 4,923 26507.06 27334.60 5,281 25198.81 5,415 24585.48 5,710 23899.15 5,891 18237.60 12,118 17184.68 6,462 17371.70 6,393 16774.66 9,308 16195.41 7,178 14523.84 7,493 13713.52 7,468 12926.70 7,704 12381.30 Markup Percentage 22% 21% 23% 21% 20% 21% 21% 21% 22% 22% 20% 20% 18% 18% 20% 19% 18% 15% 16% 12% 25% 23% 15% 16% ar 29 total 30 average 31 highest 22 Inst 1st Half + Ready C 9 fx =SUM(E4:E27) A B C D E H 1 CKG1 Jan - June Sales Summary - Actual Total Sales to Dealers Total Cost 4,486,626 5,633,561 25,278,927 46,669,867 78,110,806 83,125,521 158,329,031 18.717,583 124,983,429 130,494,256 Mfg. Cost per Model Sales Volume Vehicle VX207 126 35608.14 $ VX212 159 35431.20 VX208 32476.92 VX217 794 31837.44 VX220 1,485 31427.52 VX219 2,678 29167.59 0 VX201 2,831 29362.60 1 VX209 5,605 28247.82 2 VX204 669 27978.45 3 VX215 4,464 27998.08 14 VX210 4,923 26507.06 15 VX211 27334.60 16 VX216 5,281 25198.81 17 VX214 5,415 24585.48 18 VX224 5,710 23899.15 19 VX218 5,891 18237.60 20 VX223 12,118 17184.68 21 VX213 6,462 17371.70 22 VX206 6,393 16774.66 23 VX202 9,308 16195.41 24 VX205 7,178 14523.84 25 VX222 7,493 13713.52 26 VX221 7,468 12926.70 27 VX203 7.704 12381.30 28 29 total 110.155 576,370 30 average 5,007 23480 31 highest 12.118 35,608 Markup Percentage 22% 21% 23% 21% 20% 21% 21% 21% 22% 22% 20% 20% 18% 18% 20% 19% 18% 15% 16% 12% 25% 23% 15% + 16% % of total Volume 11% 0.1 0.0 0.7 1.3 2.4 2.6 5.1 0.6 4.1 4.5 0.0 4.8 4.9 5.2 5.3 11.0 5.9 5.8 8.4 6.5 6.8 6.8 7.0 133,074,916 133,130,374 136,464.147 107,437,702 208,243,952 112,255,925 107 240,401 150.746,876 104,252,124 102.755,405 96,536,596 95,385,535 2.163,353 560 98,334,253 208 243,952 469% 0.19 0.25
Step by Step Solution
There are 3 Steps involved in it

Get step-by-step solutions from verified subject matter experts