

Question: I need instruction and formulas on how to complete these tasks in Excel. Select the range J4:18. Enter a function in the range J4:38 to
I need instruction and formulas on how to complete these tasks in Excel.
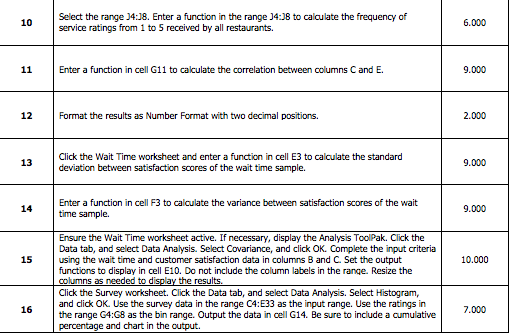
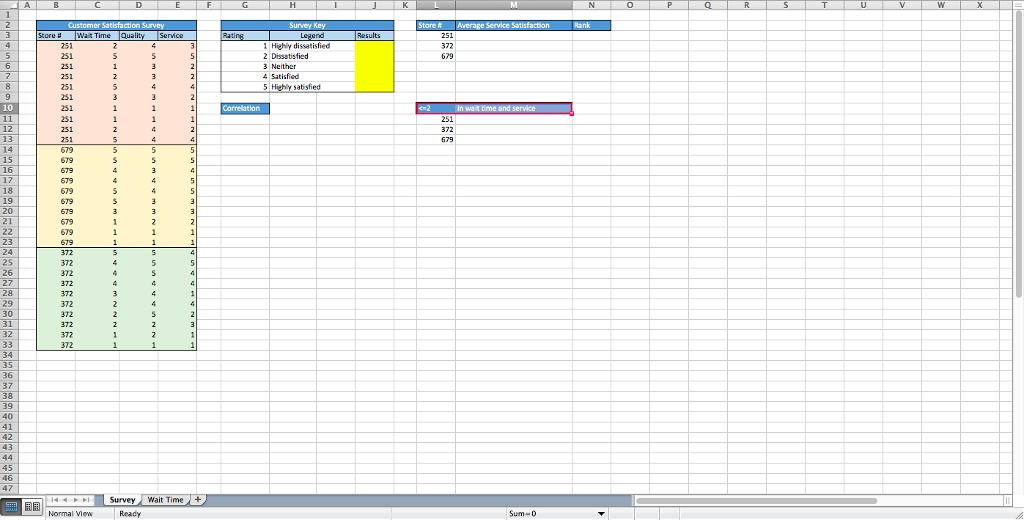
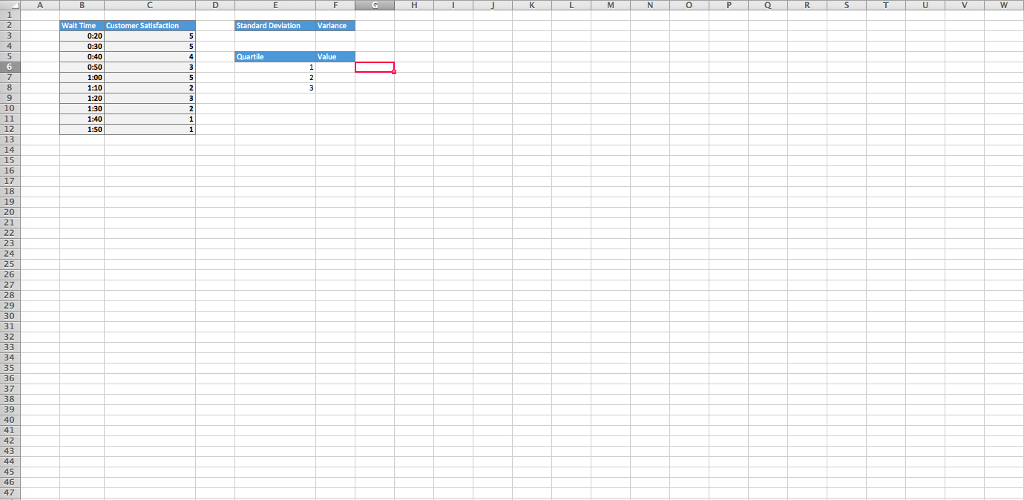
Select the range J4:18. Enter a function in the range J4:38 to calculate the frequency of service ratings from 1 to 5 received by all restaurants. 10 6.000 11 Enter a function in cell G11 to calculate the correlation between columns Cand E. 9.000 12 Format the results as Number Format with two decimal positions. 2.000 Click the Wait Time worksheet and enter a function in cell E3 to calculate the standard deviation between satisfaction scores of the wait time sample. 13 9.000 Enter a function in cell F3 to calculate the variance between satisfaction scores of the wait 14 time sample. 9.000 Ensure the Wait Time worksheet active. If necessary, display the Analysis ToolPak. Click the Data tab, and select Data Analysis. Select Covariance, and click OK. Complete the input criteria 15 using the wait time and customer satisfaction data in columns B and C. Set the output 10.000 functions to display in cell E10. Do not include the column labels in the range. Resize the Click the Survey worksheet. Click the Data tab, and select Data Analysis. Select Histogram, and click OK. Use the survey data in the range C4:E33 as the input range. Use the ratings in the range G4:G8 as the bin range. Output the data in cell G14. Be sure to include a cumulative 16 7.000 e and chart in the output
Step by Step Solution
There are 3 Steps involved in it

Get step-by-step solutions from verified subject matter experts