

Question: I need instructions on how to do this using Power BI , not Tableau, including how to know how to properly define the relationships as
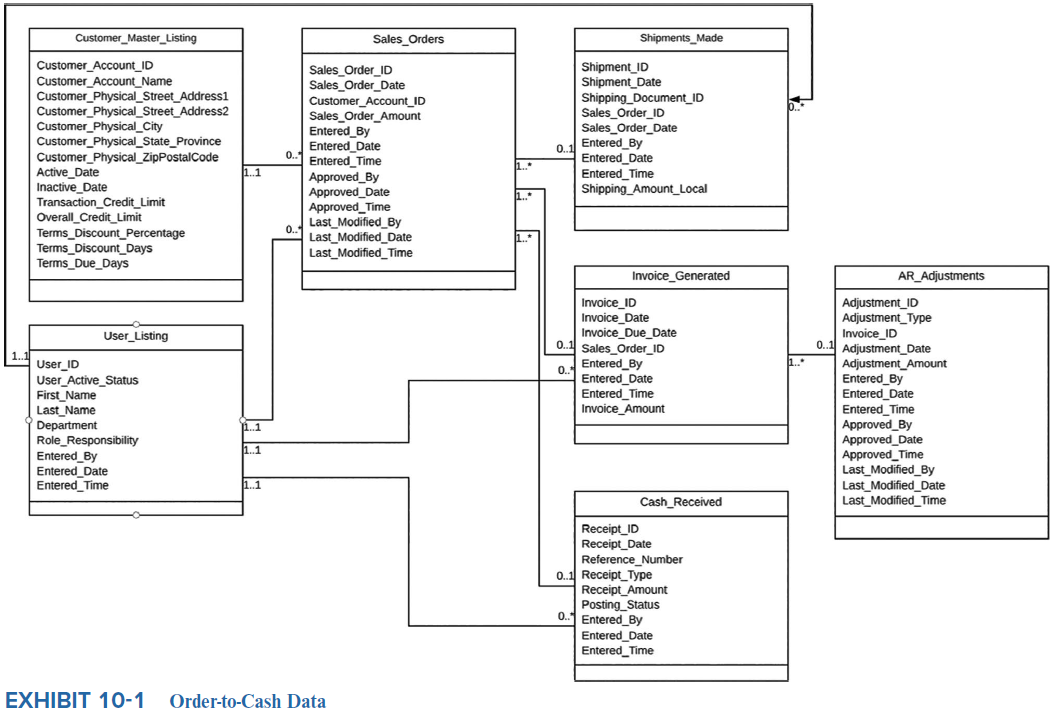
I need instructions on how to do this using Power BI not Tableau, including how to know how to properly define the relationships as shown in the attached image.
Build a new dashboard Tableau or page Power BI called Financial that includes the following:
Create a new workbook, connect to OC Data.xlsx and import all seven tables. Doublecheck the data model to ensure relationships are correctly defined as shown in Exhibit
Add a table to your worksheet or page called Sales and Receivables that shows the invoice month in each row and the invoice amount, receipt amount, adjustment amount, AR balance, and writeoff percentage in the columns. Tableau Hint: Use Measure Names in the columns and Measure Values in the marks to create your table. Then once your table is complete, use Analytics Summarize Totals to calculate column totals.
You will need to create a new measure or calculated field showing the account AR Balance, or the total invoice amount minus the total receipt amount minus the total adjustment amount. Tableau Hint: To minimize erroneous values from appearing in Tableau due to blank or missing values, use the IFNULL function to replace blank values with for example, IFNULLReceipt Amount
You will need to calculate the writeoff percentage as the total AR adjustment divided by total invoice amount. Hint: Format the writeoff percentage as a percent or to four decimals.
Filter this visual to show only values from January to December
Add a new bar chart called Bad Debts that shows the invoice amount and adjustment amount along with a tooltip for writeoff percentage. Tableau Hint: Choose Dual Axis and Synchronize Axis to combine the two values.
Filter this visual to show only values from January to December
Clean up the formatting and titles of your visuals and combine them into a single dashboard or page labeled Financial.
Take a screenshot of your dashboard showing the account balances label it A
Save your workbook as OC Analysis, answer the lab questions, then continue to Part EXHIBIT OrdertoCash Data
Step by Step Solution
There are 3 Steps involved in it
1 Expert Approved Answer
Step: 1 Unlock

Question Has Been Solved by an Expert!
Get step-by-step solutions from verified subject matter experts
Step: 2 Unlock
Step: 3 Unlock