

Question: I need it as soon as possible please B D E F G H J K L M N 0 Q 1 2 Regional Expense
I need it as soon as possible please
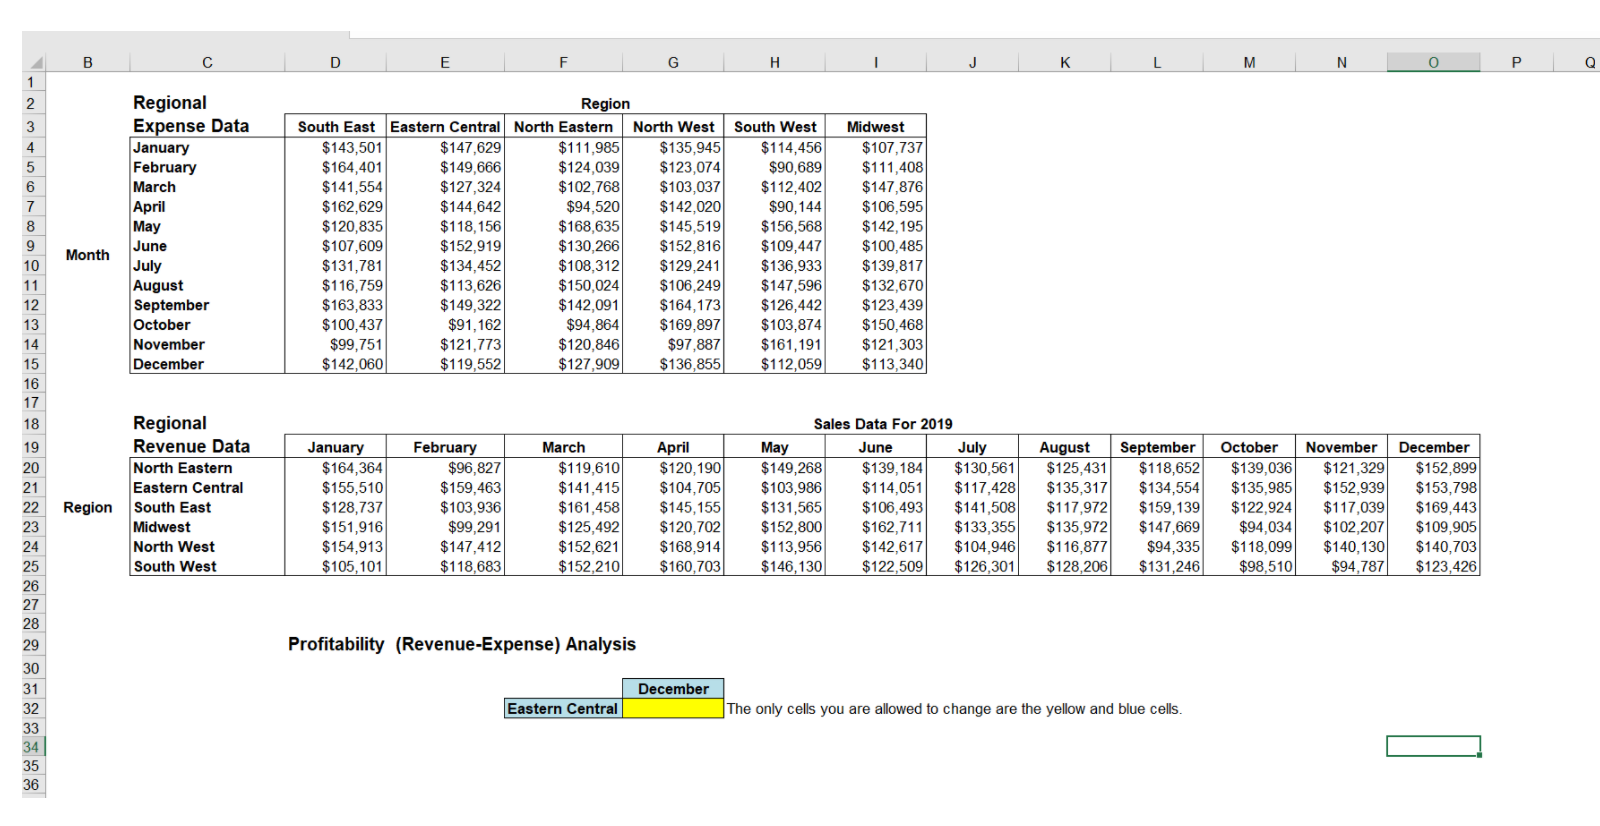
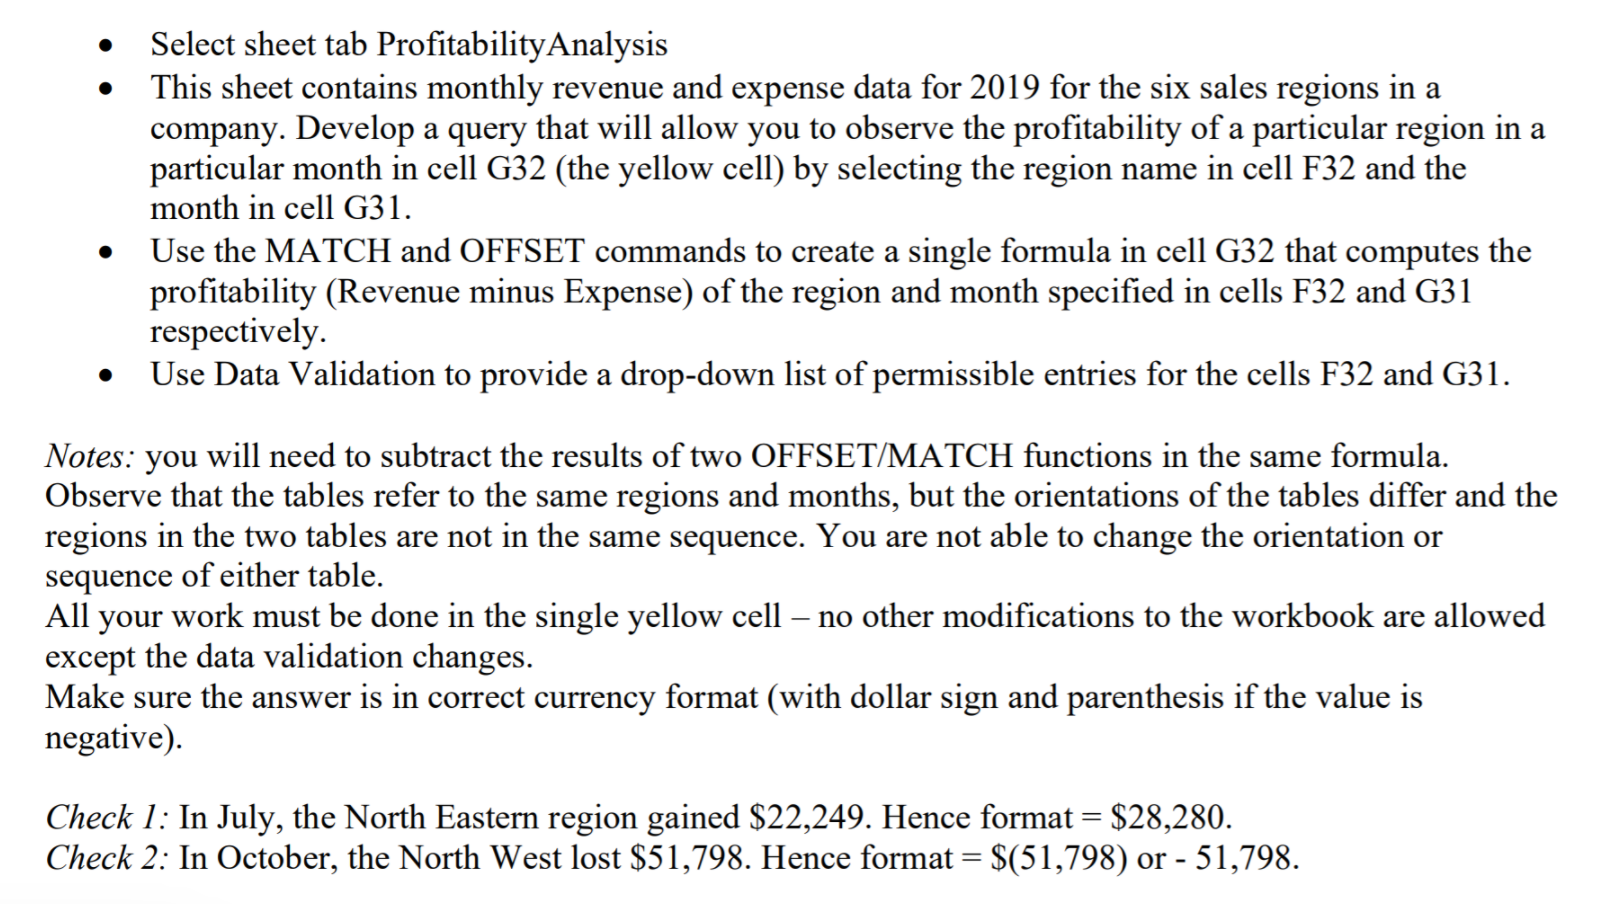
B D E F G H J K L M N 0 Q 1 2 Regional Expense Data January February March April May June July August September October November December 3 4 5 6 7 8 9 10 11 12 13 14 15 16 17 18 Region South East Eastern Central North Eastern North West $143,501 $147,629 $111.985 $135,945 $164,401 $149,666 $124,039 $123,074 $141,554 $127,324 $102,768 $ 103,037 $162,629 $144,642 $94,5201 $142,020 $120,835 $118,156 $168,635 $145,519 $107,609 $152,919 $130.266 $152,816 $131,781 $134,452 $108,312 $129,241 $116,759 $113,626 $150,024 $106,249 $ 163,833 $149,322 $142,091 $164,173 $100,437 $91,162 $94.864 $169,897 $99,751 $121,773 $120,846 $97,887 $142,060 $119,552 $127,909 $136,855 South West $114,456 $90,689 $112,402 $90,144 $156,568 $109,447 $136,933 $147,596 $126,442 $103,874 $161,191 $112,059 Midwest $107,737 $111,408 $147,876 $106,595 $142,195 $100,485 $139,817 $132,670 $123,439 $150,468 $121,303 $113,340 Month June Regional Revenue Data North Eastern Eastern Central Region South East Midwest North West South West January $164,364 $155,510 $128,737 $151,916 $154,913 $105,1011 February $96,827 $159,463 $103,936 $99,291 $147,412 $118,683 March $119,610 $141,415 $161,458 $125,492 $152,621 $152,210 April $120,190 $104,705 $145,155 $120,702 $168.914 $160,703 Sales Data For 2019 May July $149,268 $139,184 $130,561 $103,986 $114.051 $117,428 $131,565 $106,493 $141,508 $152,800 $162,711 $133,355 $113,956 $142,617 $104,946 $146,130 $122,509 $126,3011 August September $125.431 $118,652 $135,317 $134,554 $117,972 $159,139 $135,972 $147,669 $116,877 $94,335 $128,206 $131,2461 October $139,036 $135,985 $122.924 $94,034 $118,099 $98,510 November $121,329 $152.939 $117,039 $102,207 $140.130 $94.787 December $152,899 $153,798 $169,443 $109,905 $140,703 $123,426 19 20 21 22 23 24 25 26 27 28 29 30 31 32 33 34 35 36 Profitability (Revenue-Expense) Analysis December Eastern Central The only cells you are allowed to change are the yellow and blue cells. a Select sheet tab Profitability Analysis This sheet contains monthly revenue and expense data for 2019 for the six sales regions in a company. Develop a query that will allow you to observe the profitability of a particular region in a particular month in cell G32 (the yellow cell) by selecting the region name in cell F32 and the month in cell G31. Use the MATCH and OFFSET commands to create a single formula in cell G32 that computes the profitability (Revenue minus Expense) of the region and month specified in cells F32 and G31 respectively. Use Data Validation to provide a drop-down list of permissible entries for the cells F32 and G31. Notes: you will need to subtract the results of two OFFSET/MATCH functions in the same formula. Observe that the tables refer to the same regions and months, but the orientations of the tables differ and the regions in the two tables are not in the same sequence. You are not able to change the orientation or sequence of either table. All your work must be done in the single yellow cell no other modifications to the workbook are allowed except the data validation changes. Make sure the answer is in correct currency format (with dollar sign and parenthesis if the value is negative) Check 1: In July, the North Eastern region gained $22,249. Hence format = $28,280. Check 2: In October, the North West lost $51,798. Hence format = $(51,798) or - 51,798Step by Step Solution
There are 3 Steps involved in it
1 Expert Approved Answer
Step: 1 Unlock

Question Has Been Solved by an Expert!
Get step-by-step solutions from verified subject matter experts
Step: 2 Unlock
Step: 3 Unlock