

Question: I need solve this question Fruit prices and the amounts consumed for 2010 and 2018 are shown. Use 2010 as the base. 2010 2018 Fruit
I need solve this question
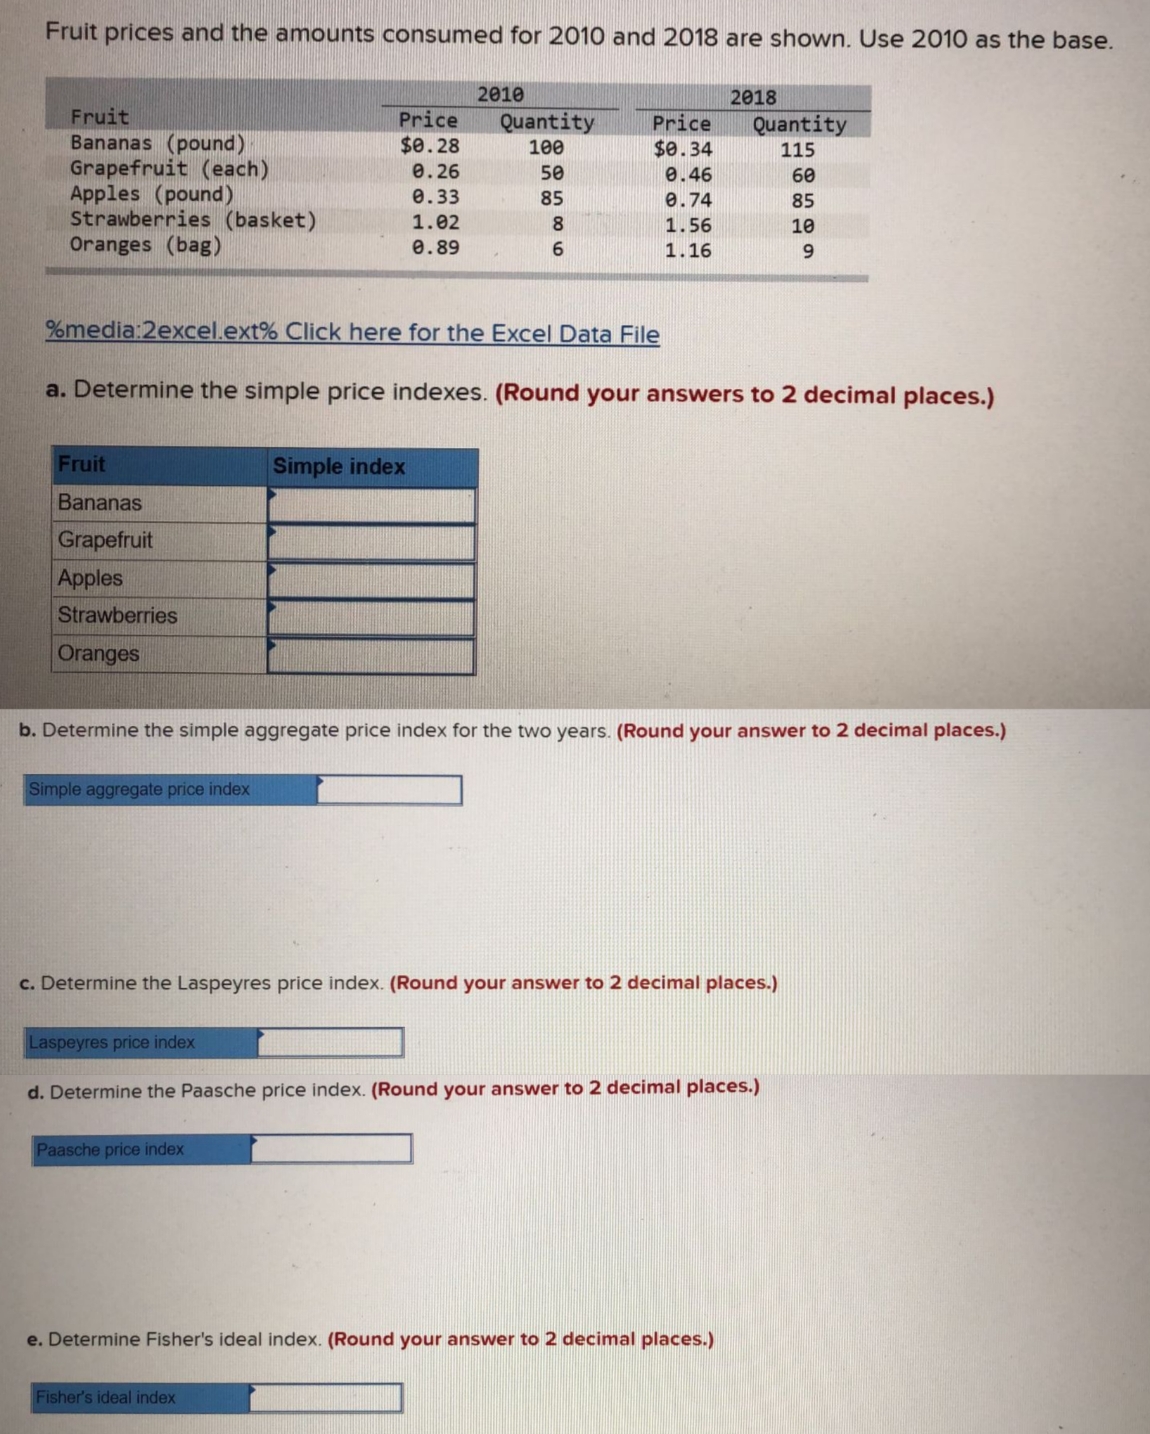
Fruit prices and the amounts consumed for 2010 and 2018 are shown. Use 2010 as the base. 2010 2018 Fruit Price Quantity Price Quantity Bananas (pound) $0. 28 100 $0 . 34 115 Grapefruit (each) 0. 26 50 0. 46 60 Apples (pound) 0. 33 85 0. 74 85 Strawberries (basket) 1.02 8 1. 56 10 Oranges (bag) 0. 89 6 1. 16 9 gomedia:2excel.ext% Click here for the Excel Data File a. Determine the simple price indexes. (Round your answers to 2 decimal places.) Fruit Simple index Bananas Grapefruit Apples Strawberries Oranges b. Determine the simple aggregate price index for the two years. (Round your answer to 2 decimal places.) Simple aggregate price index c. Determine the Laspeyres price index. (Round your answer to 2 decimal places.) Laspeyres price index d. Determine the Paasche price index. (Round your answer to 2 decimal places.) Paasche price index e. Determine Fisher's ideal index. (Round your answer to 2 decimal places.) Fisher's ideal index
Step by Step Solution
There are 3 Steps involved in it

Get step-by-step solutions from verified subject matter experts