

Question: Question 3. Fruit prices and the amounts consumed for 1999 and 2012 are below. Use 1999 as the base. Fruit Price (1999) Quantity (1999) Price
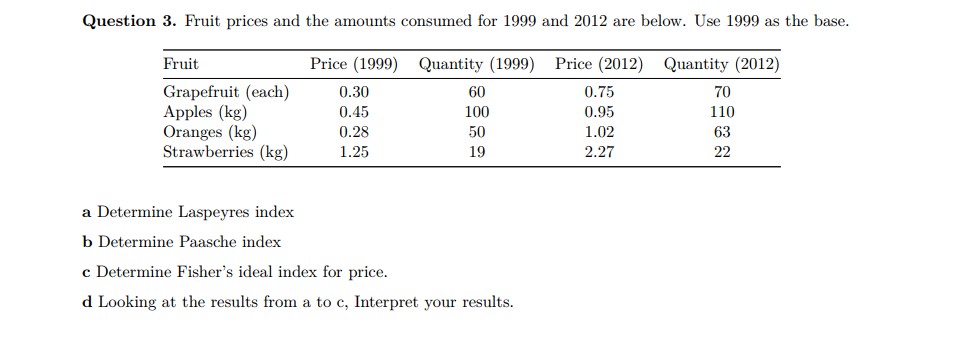
Question 3. Fruit prices and the amounts consumed for 1999 and 2012 are below. Use 1999 as the base. Fruit Price (1999) Quantity (1999) Price (2012) Quantity (2012) Grapefruit (each) 0.30 60 0.75 70 Apples (kg) 0.45 100 0.95 110 Oranges (kg) 0.28 50 1.02 63 Strawberries (kg) 1.25 19 2.27 22 a Determine Laspeyres index b Determine Paasche index c Determine Fisher's ideal index for price. d Looking at the results from a to c, Interpret your results
Step by Step Solution
There are 3 Steps involved in it
1 Expert Approved Answer
Step: 1 Unlock

Question Has Been Solved by an Expert!
Get step-by-step solutions from verified subject matter experts
Step: 2 Unlock
Step: 3 Unlock