

Question: I need some assitance in doing a matlab assignment. The assignment is to graph the binomial PDF, and frequency of distributions of 10,000 coin tosses
I need some assitance in doing a matlab assignment.
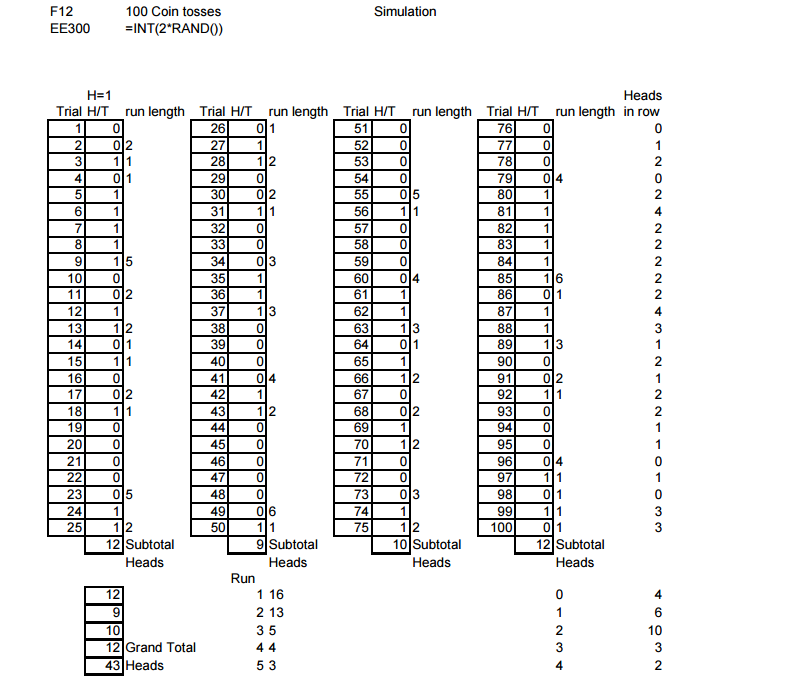
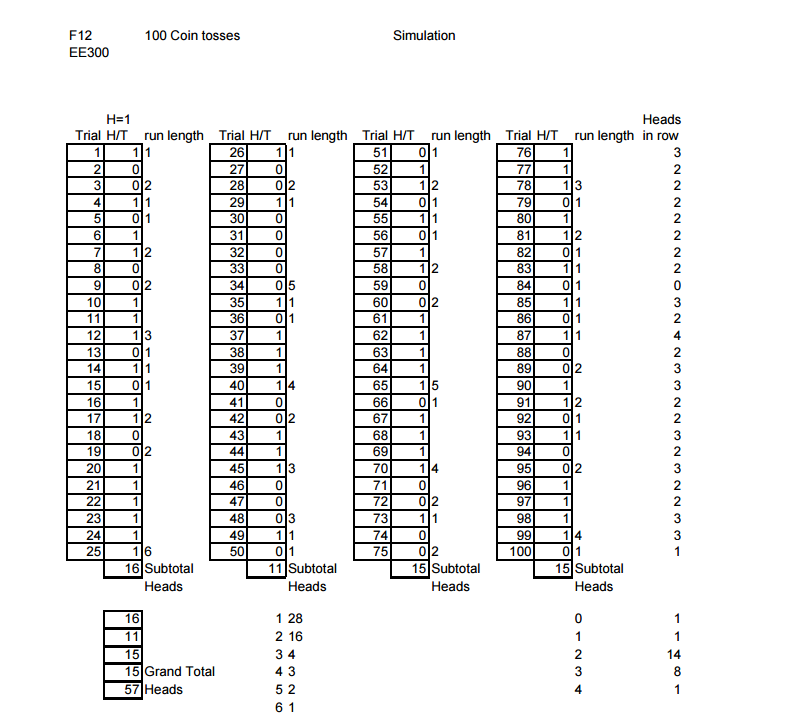
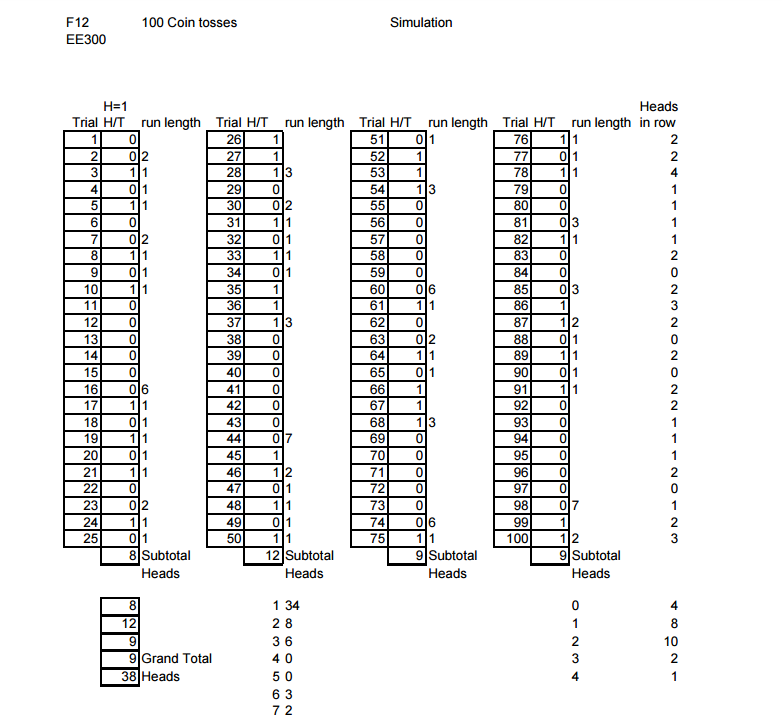
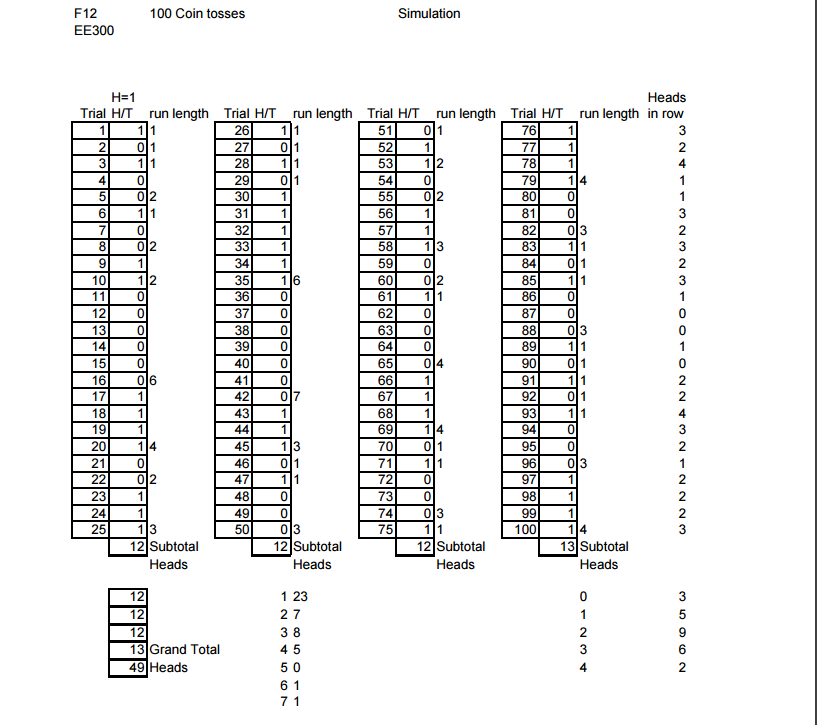
The assignment is to graph the binomial PDF, and frequency of distributions of 10,000 coin tosses (a minimum of 2500 sets of 4 each) in two ways:
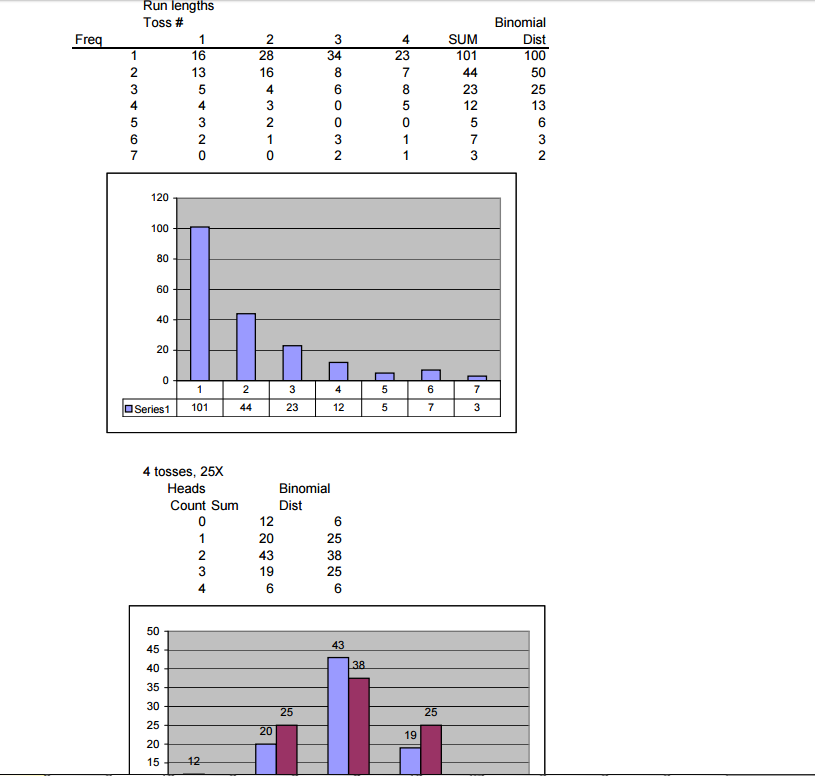
For each row in all 4 columns, add the number of heads (0-4 heads) for each row, and plot that on a histogram. Contrast the actual values with the expected values based on a binomial distribution for sets of 4 coin tosses.
For your entire sequence, count the number of occurrences of the run lengths (1 heads, 2 heads in a row, 3 heads in a row, etc.) and graph that distribution histogram. See the sample emptyCoinTossForm.xls file and the example CoinTossSim4x.pdf file shows the results for a combined set of four simulated 100 coin toss experiments.
The observed Run-length PDF can be approximated by a binomial distribution, but it is actually a different probability distribution function. Identify the type of distribution and include it in your report.
Much greater than 100 tosses is required to obtain a reasonable approximation of the binomial distribution.
The sample/examples:
Step by Step Solution
There are 3 Steps involved in it

Get step-by-step solutions from verified subject matter experts