

Question: I need some help on this excel problem This data contains the SAT math scores for 15 students in 2013 and 17 students in 2014.
I need some help on this excel problem
This data contains the SAT math scores for 15 students in 2013 and 17 students in 2014. At the 5% level of significance, how do I test to see if the data set supports the hypothesis that the mean score in 2014 was different than the mean score in 2013?
- How is this done in excel?
- What is the null and alternate hypothesis and do we reject it?
- What is our final conclusion about the hypothesis?
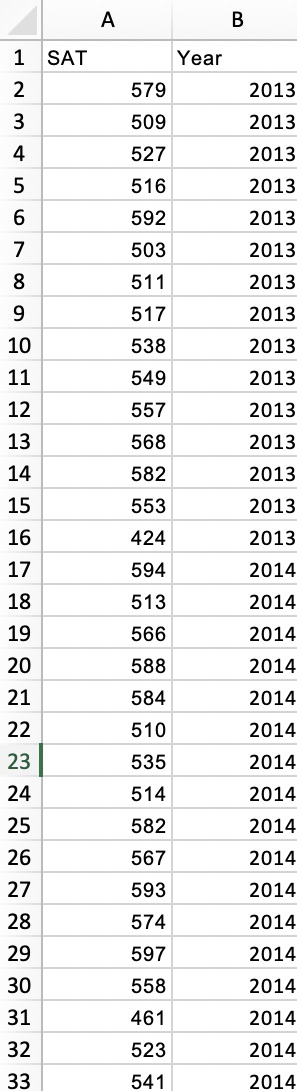
A B 1 SAT Year 2 579 2013 509 2013 527 2013 516 2013 592 2013 503 2013 511 2013 517 2013 10 538 2013 11 549 2013 12 557 2013 13 568 2013 14 582 2013 15 553 2013 16 424 2013 17 594 2014 18 513 2014 19 566 2014 20 588 2014 21 584 2014 22 510 2014 23 535 2014 24 514 2014 25 582 2014 26 567 2014 27 593 2014 28 574 2014 29 597 2014 30 558 2014 31 461 2014 32 523 2014 33 541 2014
Step by Step Solution
There are 3 Steps involved in it

Get step-by-step solutions from verified subject matter experts