

Question: I need some help please! 1. Quick Ratio for 2019 and 2020. 2. Are the numbers getting better from 2019 to 2020 for each formula?
I need some help please!
1. Quick Ratio for 2019 and 2020.
2. Are the numbers getting better from 2019 to 2020 for each formula?
3. Is the 2020 number good or bad compared to what the industry average is!
Please help!
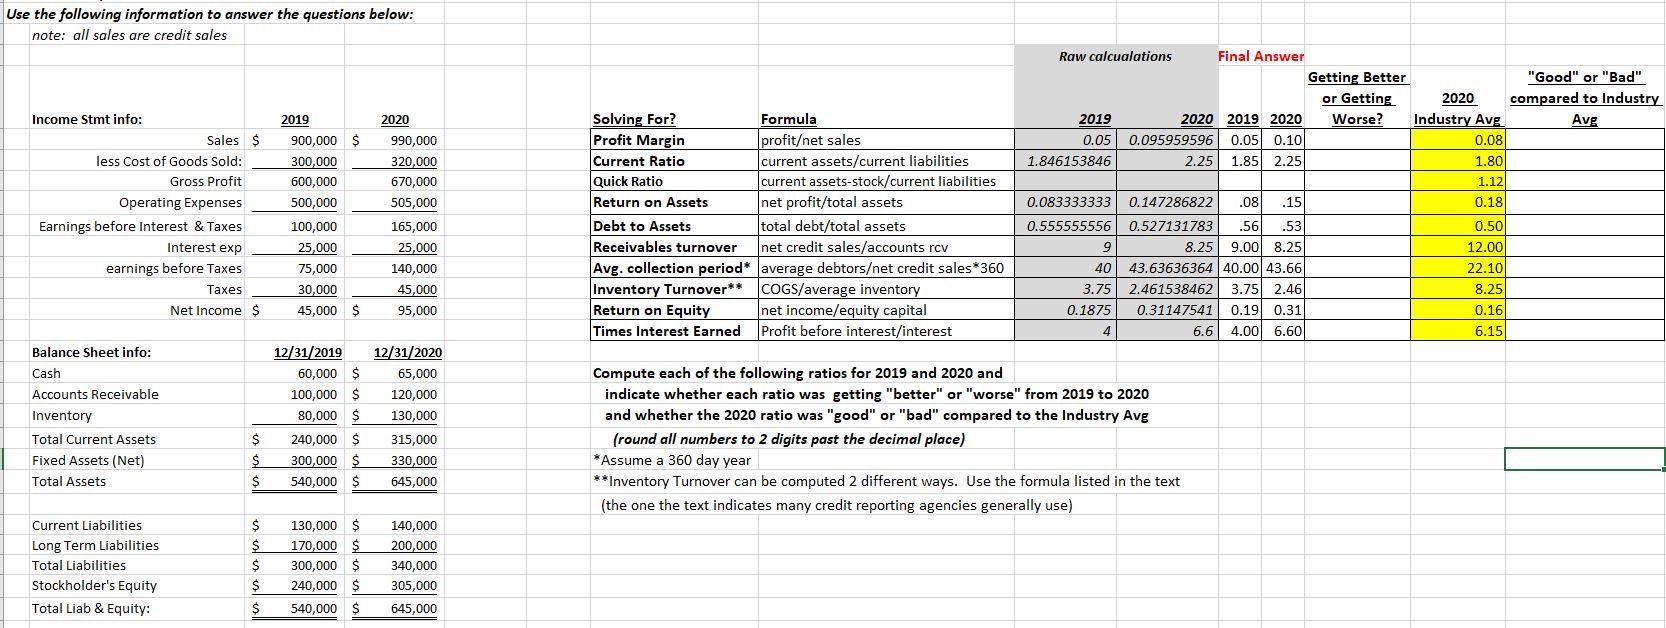
Use the following information to answer the questions below: note: all sales are credit sales 2020 990,000 $ 2019 900,000 300,000 600,000 500,000 2.25 320,000 670,000 505,000 Income Stmt info: Sales $ less Cost of Goods Sold: Gross Profit Operating Expenses Earnings before Interest & Taxes Interest exp earnings before Taxes Taxes Net Income $ Raw calcualations Final Answer Getting Better "Good" or "Bad" or Getting 2020 compared to Industry 2019 2020 2019 2020 Worse? Industry Avg Avg 0.05 0.095959596 0.05 0.101 0.08 1.846153846 1.85 2.25 1.80 1.12 0.083333333 0.147286822 .08 .15 0.18 0.555555556 0.527131783 .56 53 0.50 9 8.25 9.00 8.25 12.000 40 43.63636364 40.00 43.66 22.10 3.75 2.461538462 3.75 2.46 8.25 0.1875 0.31147541 0.19 0.31 0.16) 6.6 4.00 6.60 6.15 100,000 25,000 75,000 30,000 45,000 $ Solving For? Formula Profit Margin profitet sales Current Ratio current assets/current liabilities Quick Ratio current assets-stock/current liabilities Return on Assets net profit/total assets Debt to Assets total debt/total assets Receivables turnover net credit sales/accounts rcv Avg. collection period* average debtorset credit sales * 360 Inventory Turnover** COGS/average inventory Return on Equity net income/equity capital Times Interest Earned Profit before interest/interest 165,000 25,000 140,000 45,000 95,000 Balance Sheet info: Cash Accounts Receivable Inventory Total Current Assets Fixed Assets (Net) Total Assets 12/31/2019 60,000 $ 100,000 $ 80,000 $ 12/31/2020 65,000 120,000 130,000 315,000 330,000 645,000 $ $ $ $ 240,000 300,000 540,000 Compute each of the following ratios for 2019 and 2020 and indicate whether each ratio was getting "better" or "worse" from 2019 to 2020 and whether the 2020 ratio was "good" or "bad" compared to the Industry Avg (round all numbers to 2 digits past the decimal place) * Assume a 360 day year **Inventory Turnover can be computed 2 different ways. Use the formula listed in the text (the one the text indicates many credit reporting agencies generally use) $ $ $ Current Liabilities Long Term Liabilities Total Liabilities Stockholder's Equity Total Liab & Equity: $ $ $ 130,000 $ 170,000 $ 300,000 $ 240,000 $ 140,000 200,000 340,000 305,000 645,000 $ 540.000 $
Step by Step Solution
There are 3 Steps involved in it

Get step-by-step solutions from verified subject matter experts