

Question: I need some help with this SPSS problem. Thank you. RESEARCH QUESTION 1: Is height related to job satisfaction? Height was measured as the height
I need some help with this SPSS problem. Thank you.
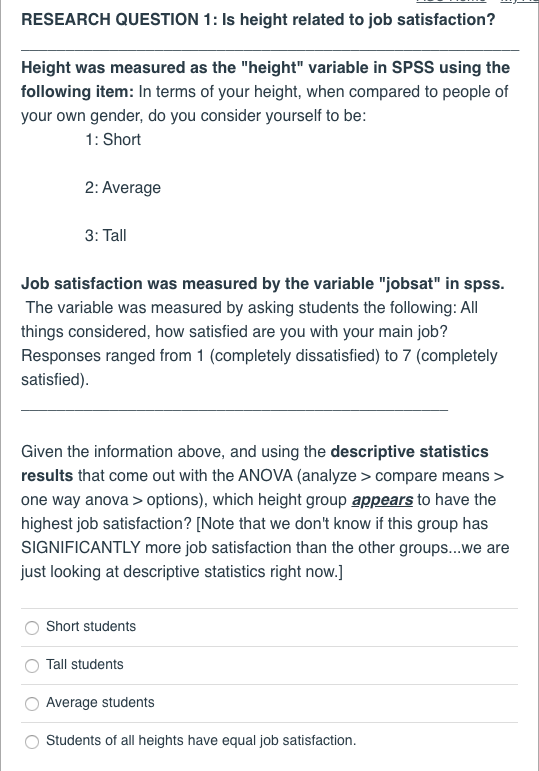
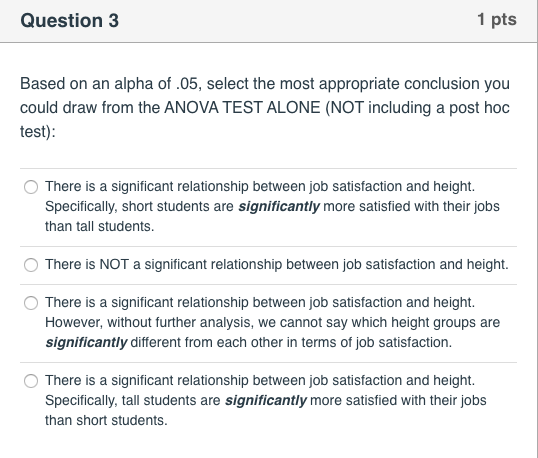
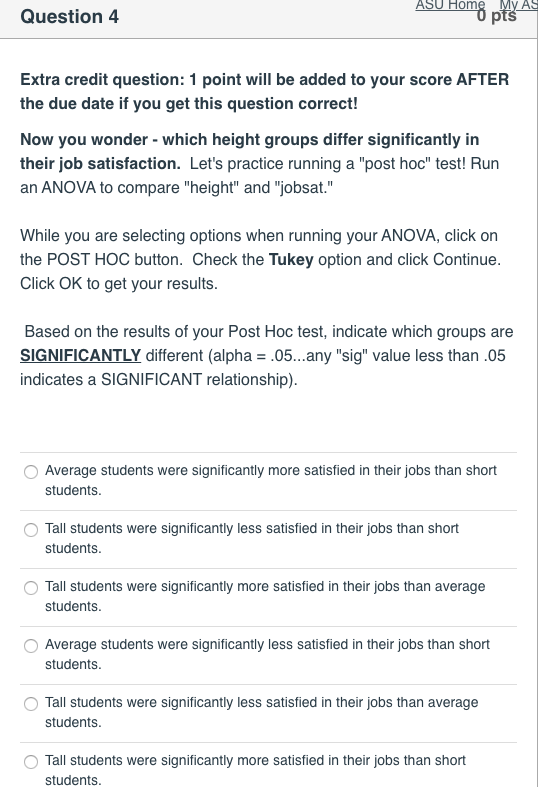
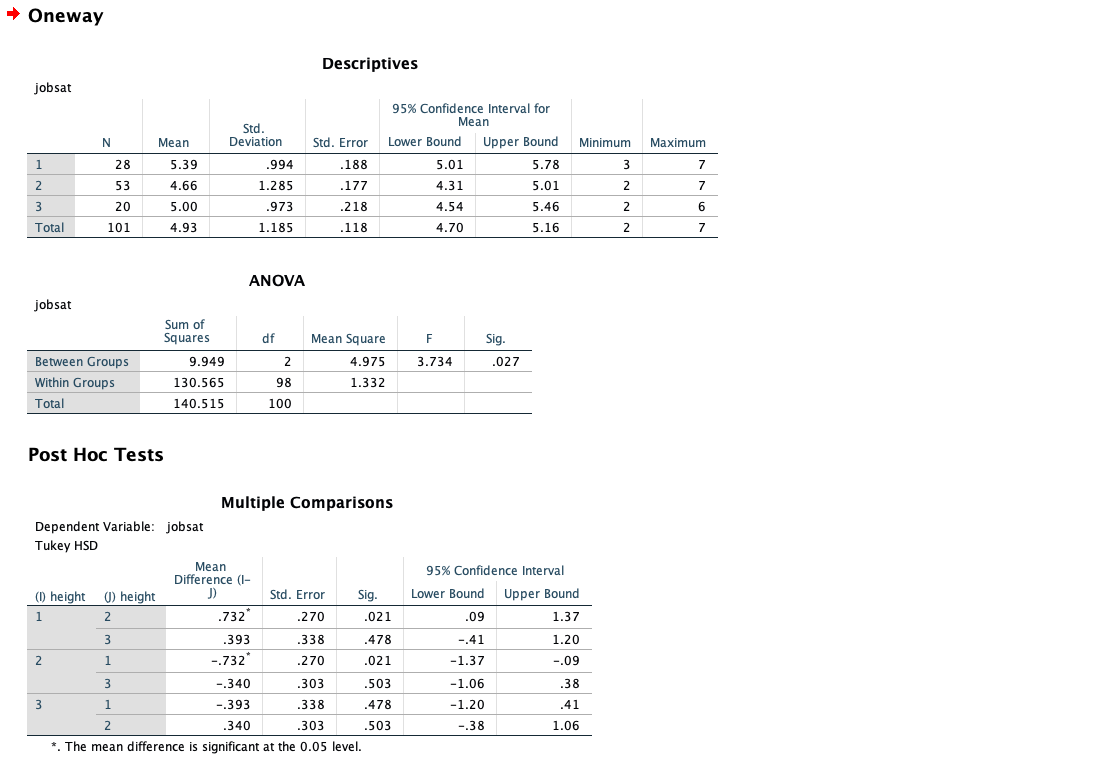
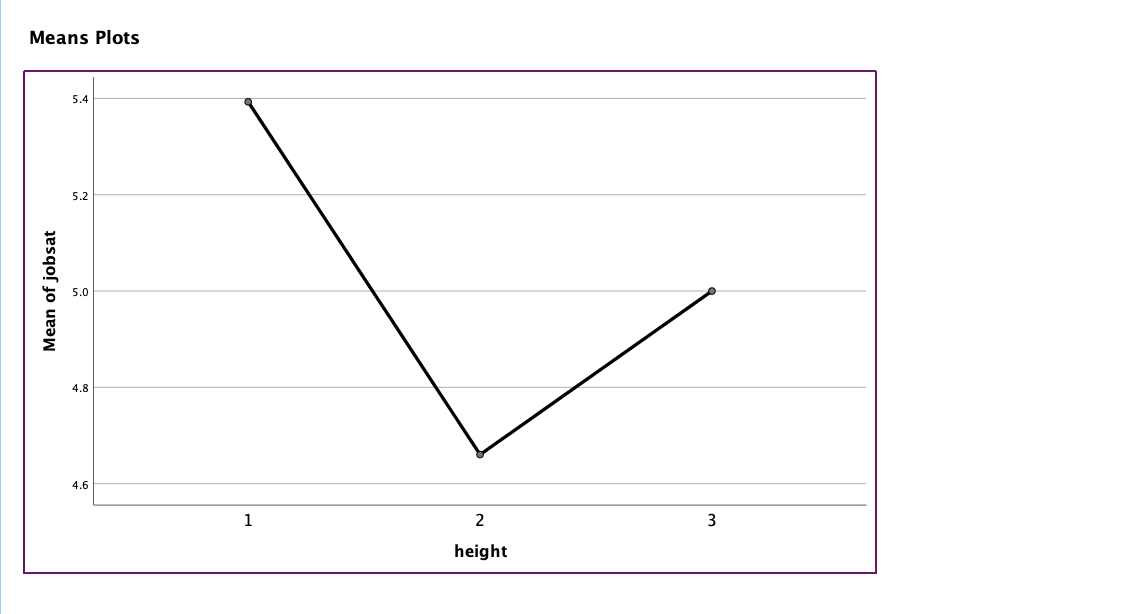
RESEARCH QUESTION 1: Is height related to job satisfaction? Height was measured as the "height" variable in SPSS using the following item: In terms of your height, when compared to people of your own gender, do you consider yourself to be: 1: Short 2: Average 3: Tall Job satisfaction was measured by the variable "jobsat" in spss. The variable was measured by asking students the following: All things considered, how satisfied are you with your main job? Responses ranged from 1 (completely dissatisfied) to 7 (completely satisfied). Given the information above, and using the descriptive statistics results that come out with the ANOVA (analyze > compare means > one way anova > options), which height group appears to have the highest job satisfaction? [Note that we don't know if this group has SIGNIFICANTLY more job satisfaction than the other groups...we are just looking at descriptive statistics right now.] O Short students O Tall students Average students O Students of all heights have equal job satisfaction.Question 2 2 pts After running the ANOVA to see if height is related to job satisfaction, you find the F value is and its accompanying significance value is Enter the F and significance values rounded to THREE decimal places.Question 3 1 pts Based on an alpha of .05, select the most appropriate conclusion you could draw from the ANOVA TEST ALONE (NOT including a post hoc test): O There is a significant relationship between job satisfaction and height. Specifically, short students are significantly more satisfied with their jobs than tall students. O There is NOT a significant relationship between job satisfaction and height. O There is a significant relationship between job satisfaction and height. However, without further analysis, we cannot say which height groups are significantly different from each other in terms of job satisfaction. O There is a significant relationship between job satisfaction and height. Specifically, tall students are significantly more satisfied with their jobs than short students.Question 4 ASU Home My AS 0 pts Extra credit question: 1 point will be added to your score AFTER the due date if you get this question correct! Now you wonder - which height groups differ significantly in their job satisfaction. Let's practice running a "post hoc" test! Run an ANOVA to compare "height" and "jobsat." While you are selecting options when running your ANOVA, click on the POST HOC button. Check the Tukey option and click Continue. Click OK to get your results. Based on the results of your Post Hoc test, indicate which groups are SIGNIFICANTLY different (alpha = .05...any "sig" value less than .05 indicates a SIGNIFICANT relationship). Average students were significantly more satisfied in their jobs than short students. O Tall students were significantly less satisfied in their jobs than short students. O Tall students were significantly more satisfied in their jobs than average students. O Average students were significantly less satisfied in their jobs than short students. O Tall students were significantly less satisfied in their jobs than average students. O Tall students were significantly more satisfied in their jobs than short students.+ Oneway Descriptives jobsat 95% Confidence Interval for Std. Mean N Mean Deviation Std. Error Lower Bound Upper Bound Minimum Maximum 1 28 5.39 994 188 5.01 5.78 3 7 2 53 4.66 1.285 177 4.31 5.01 7 3 20 5.00 973 .218 4.54 5.46 NN 6 Total 101 4.93 1.185 118 4.70 5.16 2 7 ANOVA jobsat Sum of Squares df Mean Square F Sig. Between Groups 9.949 2 4.975 3.734 027 Within Groups 130.565 98 1.332 Total 140.515 100 Post Hoc Tests Multiple Comparisons Dependent Variable: jobsat Tukey HSD Mean Difference (1- 95% Confidence Interval (D) height () height J) Std. Error Sig. Lower Bound Upper Bound 1 2 732 270 .021 .09 1.37 393 .338 478 -.41 1.20 2 1 -.732 270 021 -1.37 -.09 -.340 303 503 -1.06 38 3 N H W -.393 338 478 -1.20 .41 340 .303 503 -.38 1.06 *. The mean difference is significant at the 0.05 level.\f
Step by Step Solution
There are 3 Steps involved in it

Get step-by-step solutions from verified subject matter experts