

Question: I need some help with this stats problem Data: https://www.limes.one/Content/DataFiles/Man_body.txt Upload the ManBody data. Create a scattered plot chart with X representing the Age and
I need some help with this stats problem
Data: https://www.limes.one/Content/DataFiles/Man_body.txt
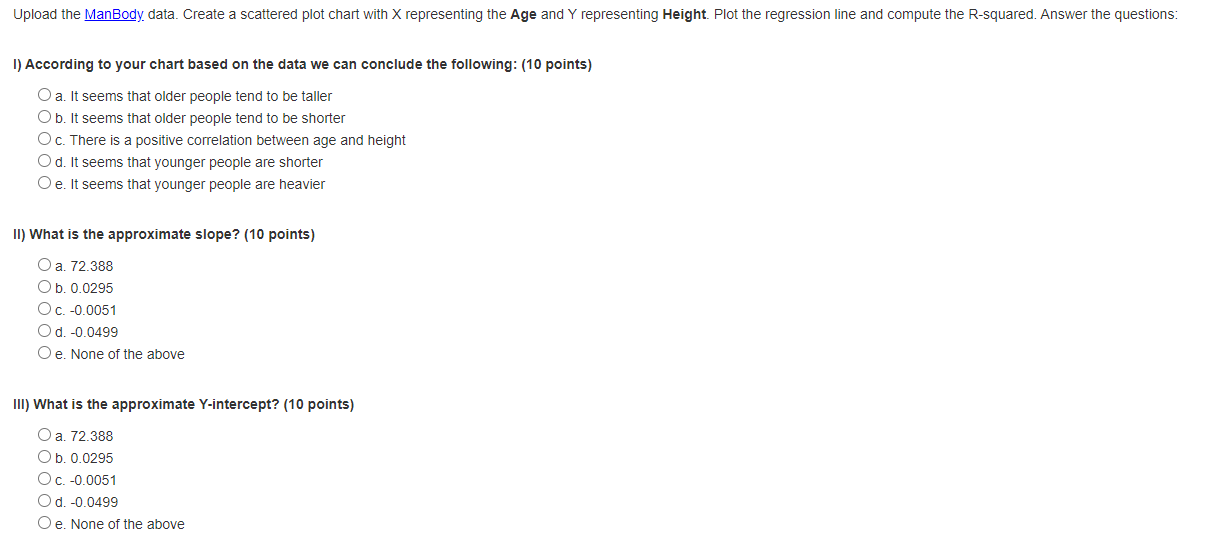
Upload the ManBody data. Create a scattered plot chart with X representing the Age and Y representing Height. Plot the regression line and compute the Rsquared. Answer the questrons: I] According to your chart based on the data we can conclude the following: (10 points) 0 a. tt seems that older people tend to be taller O t). tt seems that older people tend to be shorter O c. There is a positive correlation between age and height 0 d. tt seems that younger people are shorter 0 e. tt seems that younger people are heavier ll) What is the approximate slope? [10 points} 0 a. 72.383 0 [3. 0.0295 0 c. 70.0051 0 (1. 41.0499 0 e. None of the above Ill) What is the approximate Y-intercept? (10 points) 0 a. 72.383 0 b. 0.0295 0 6. 410051 0 d. o.0499 0 e. None of the above
Step by Step Solution
There are 3 Steps involved in it

Get step-by-step solutions from verified subject matter experts