

Question: Upload the ManBody data. Create a scattered plot chart with X representing the Age and Y representing Weight. Plot the regression line and compute the
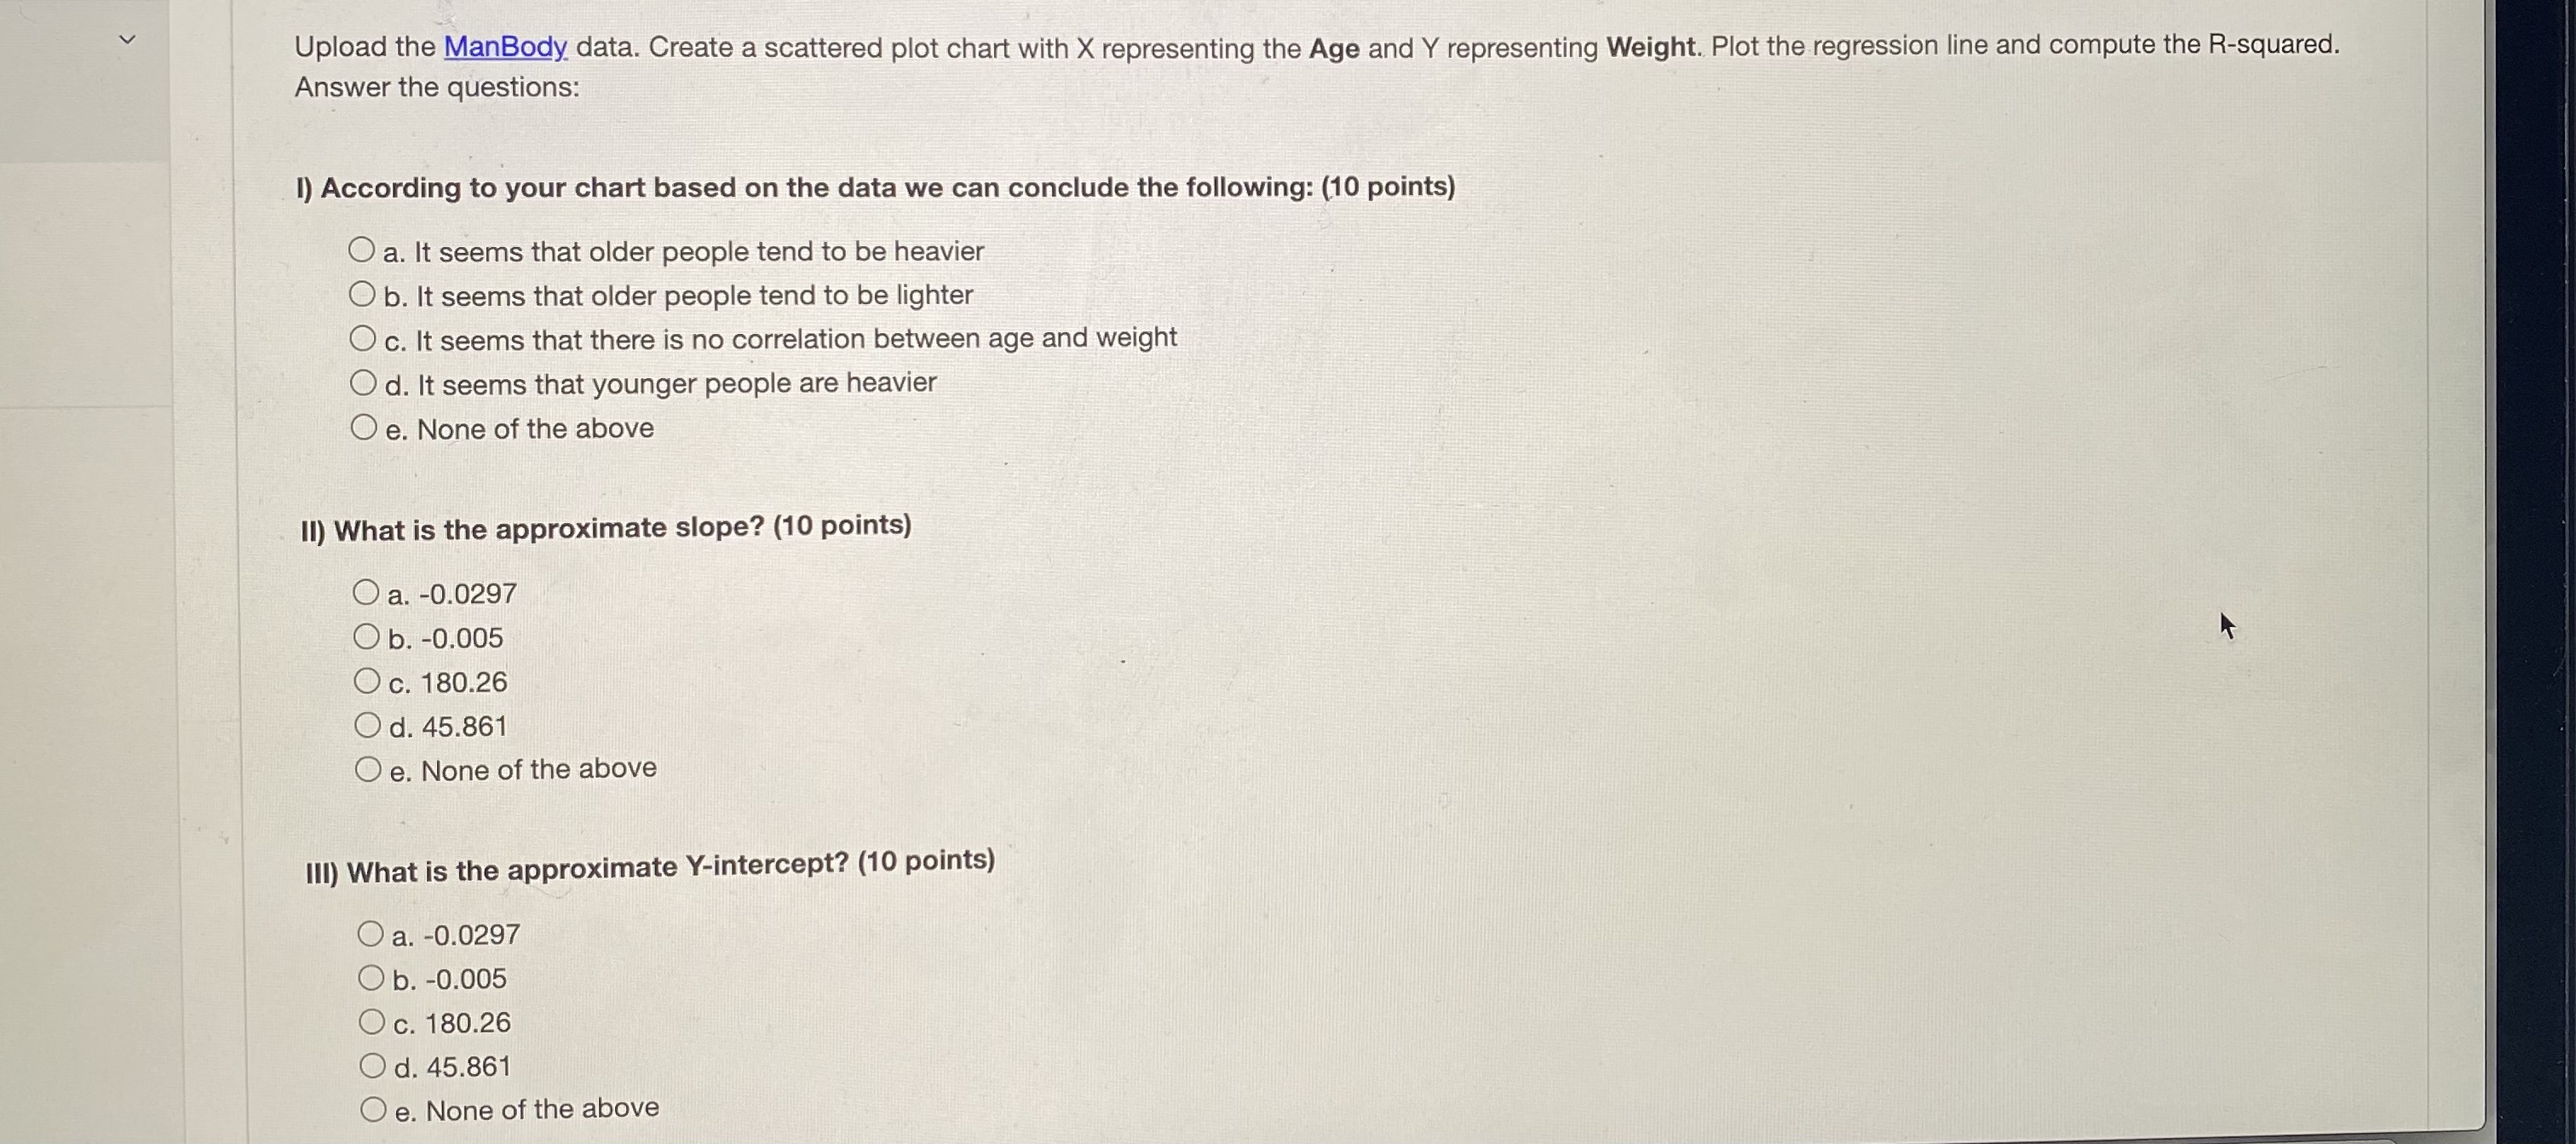
Upload the ManBody data. Create a scattered plot chart with X representing the Age and Y representing Weight. Plot the regression line and compute the R-squared. Answer the questions: I) According to your chart based on the data we can conclude the following: (10 points) O a. It seems that older people tend to be heavier O b. It seems that older people tend to be lighter O c. It seems that there is no correlation between age and weight O d. It seems that younger people are heavier O e. None of the above Il) What is the approximate slope? (10 points) O a. -0.0297 O b. -0.005 O c. 180.26 O d. 45.861 O e. None of the above Ill) What is the approximate Y-intercept? (10 points) O a. -0.0297 Ob. -0.005 O c. 180.26 O d. 45.861 O e. None of the above
Step by Step Solution
There are 3 Steps involved in it

Get step-by-step solutions from verified subject matter experts