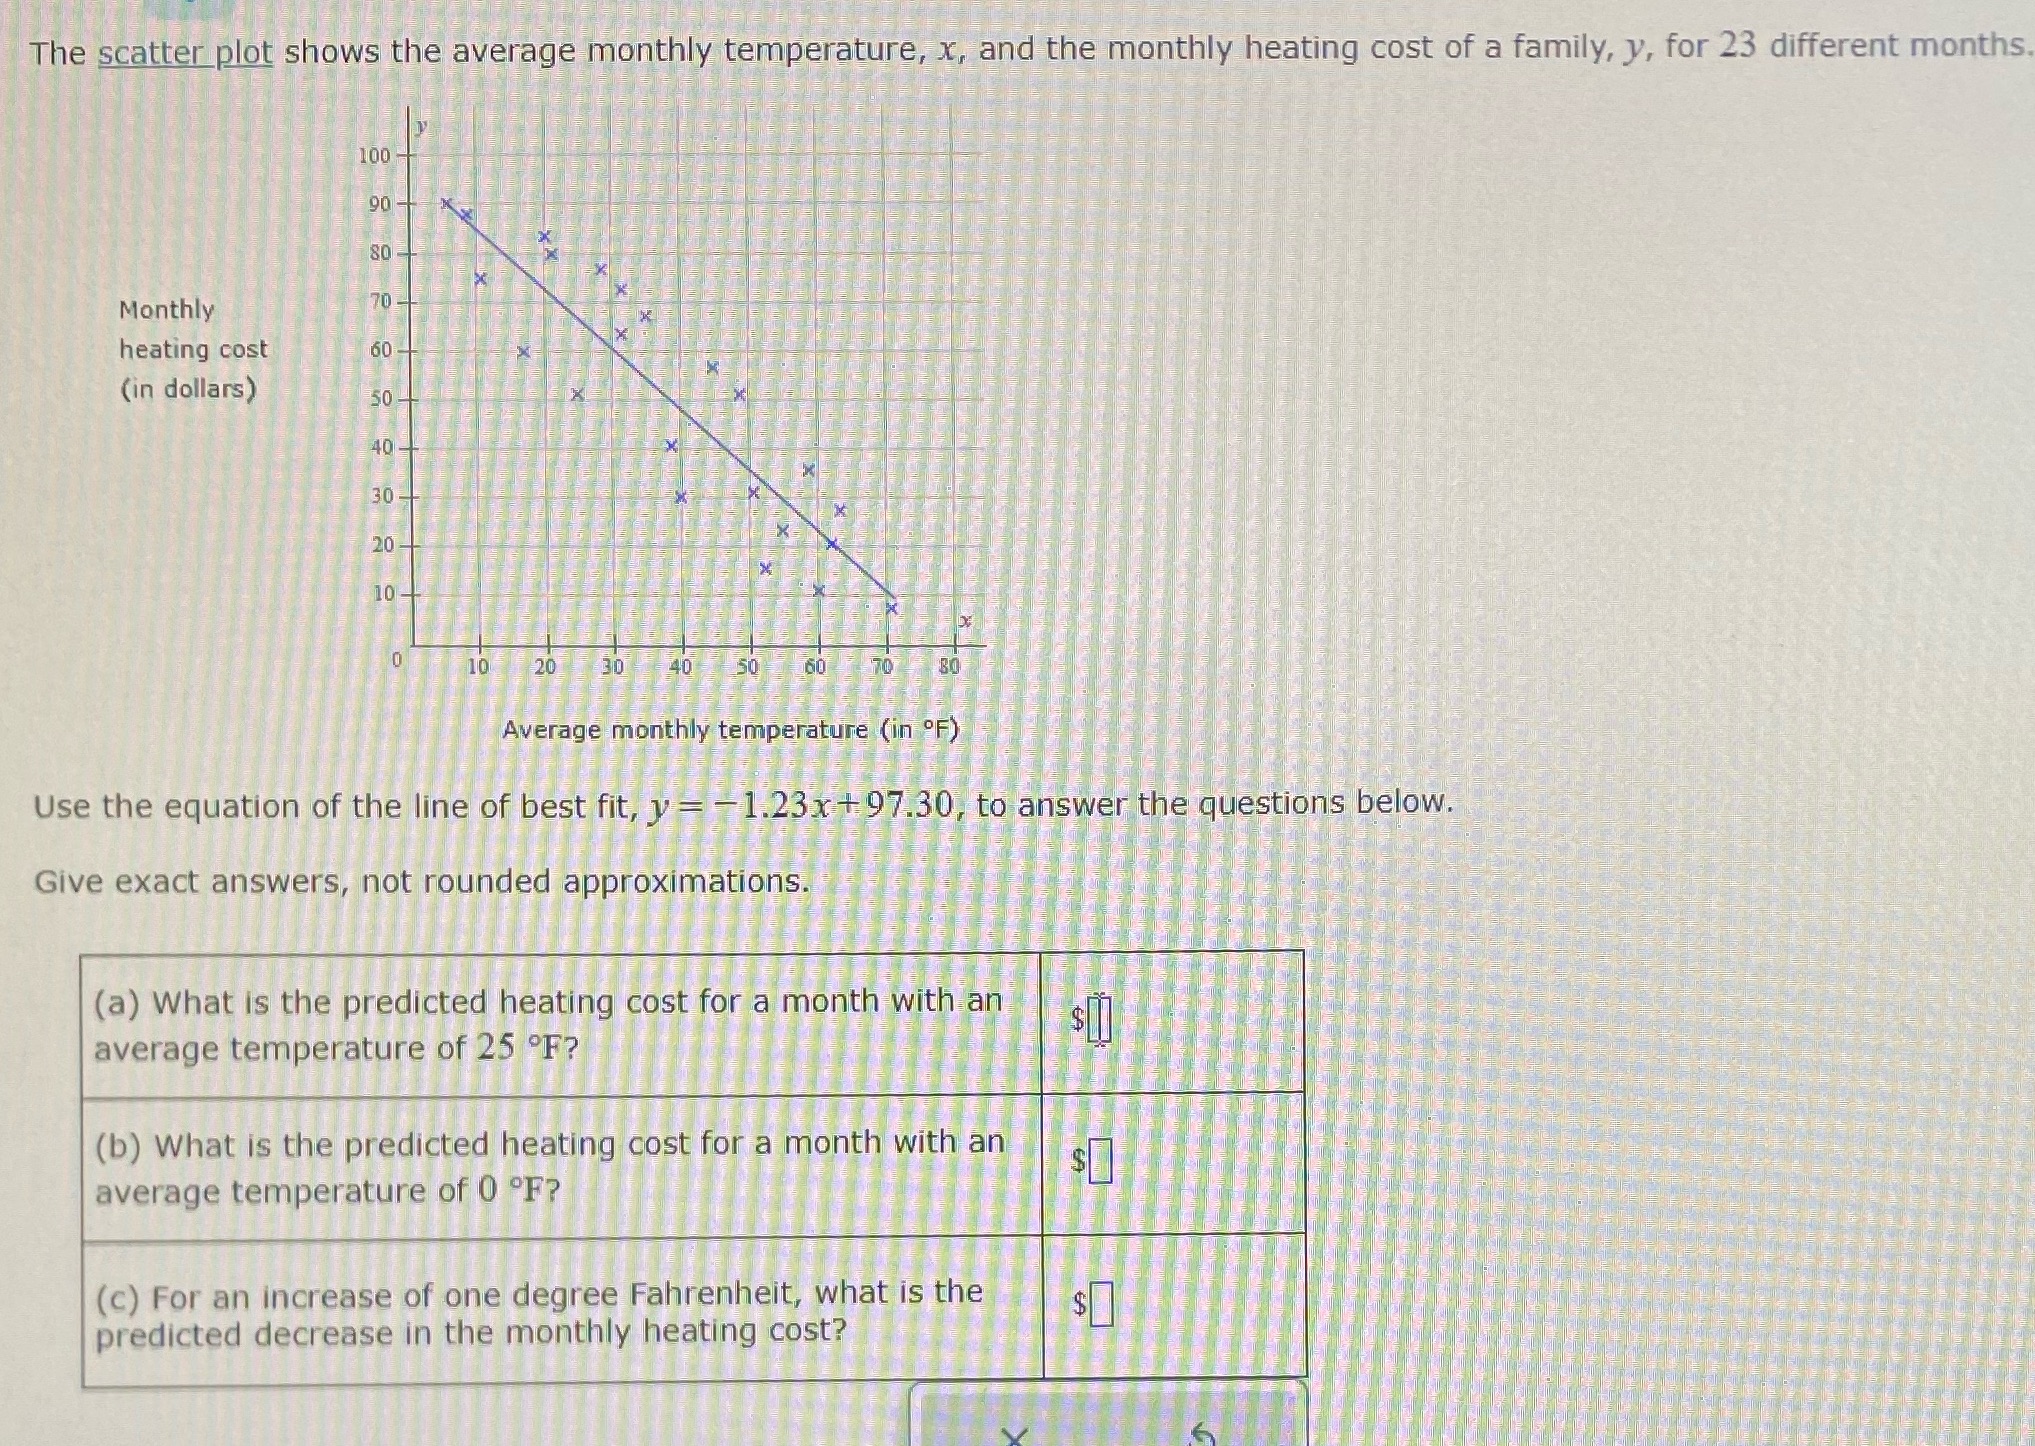
Question: I need some help with this The scatter plot shows the average monthly temperature, x, and the monthly heating cost of a family, y, for

I need some help with this

I need some help with this The scatter plot shows
The scatter plot shows the average monthly temperature, x, and the monthly heating cost of a family, y, for 23 different months 100- 90 80 Monthly 70 heating cost 60 (in dollars) 30 - 40 30 20 10- 10 20 Average monthly temperature (in OF) Use the equation of the line of best fit, y = -1.23x +97.30, to answer the questions below. Give exact answers, not rounded approximations. (a) What is the predicted heating cost for a month with an average temperature of 25 .F? (b) What is the predicted heating cost for a month with an average temperature of 0 .F? $0 (c) For an increase of one degree Fahrenheit, what is the $1 predicted decrease in the monthly heating cost

Step by Step Solution

There are 3 Steps involved in it

1 Expert Approved Answer
Step: 1 Unlock blur-text-image
Question Has Been Solved by an Expert!

Get step-by-step solutions from verified subject matter experts

Step: 2 Unlock
Step: 3 Unlock

Students Have Also Explored These Related Mathematics Questions!