

Question: I need someone to explain in details please, please support with explaining all the learning screenshots, don't rely on my answer, it could be wrong,
I need someone to explain in details please, please support with explaining all the learning screenshots, don't rely on my answer, it could be wrong, I need your instruction for each question. I am not copying your work but just need to explain it in details.
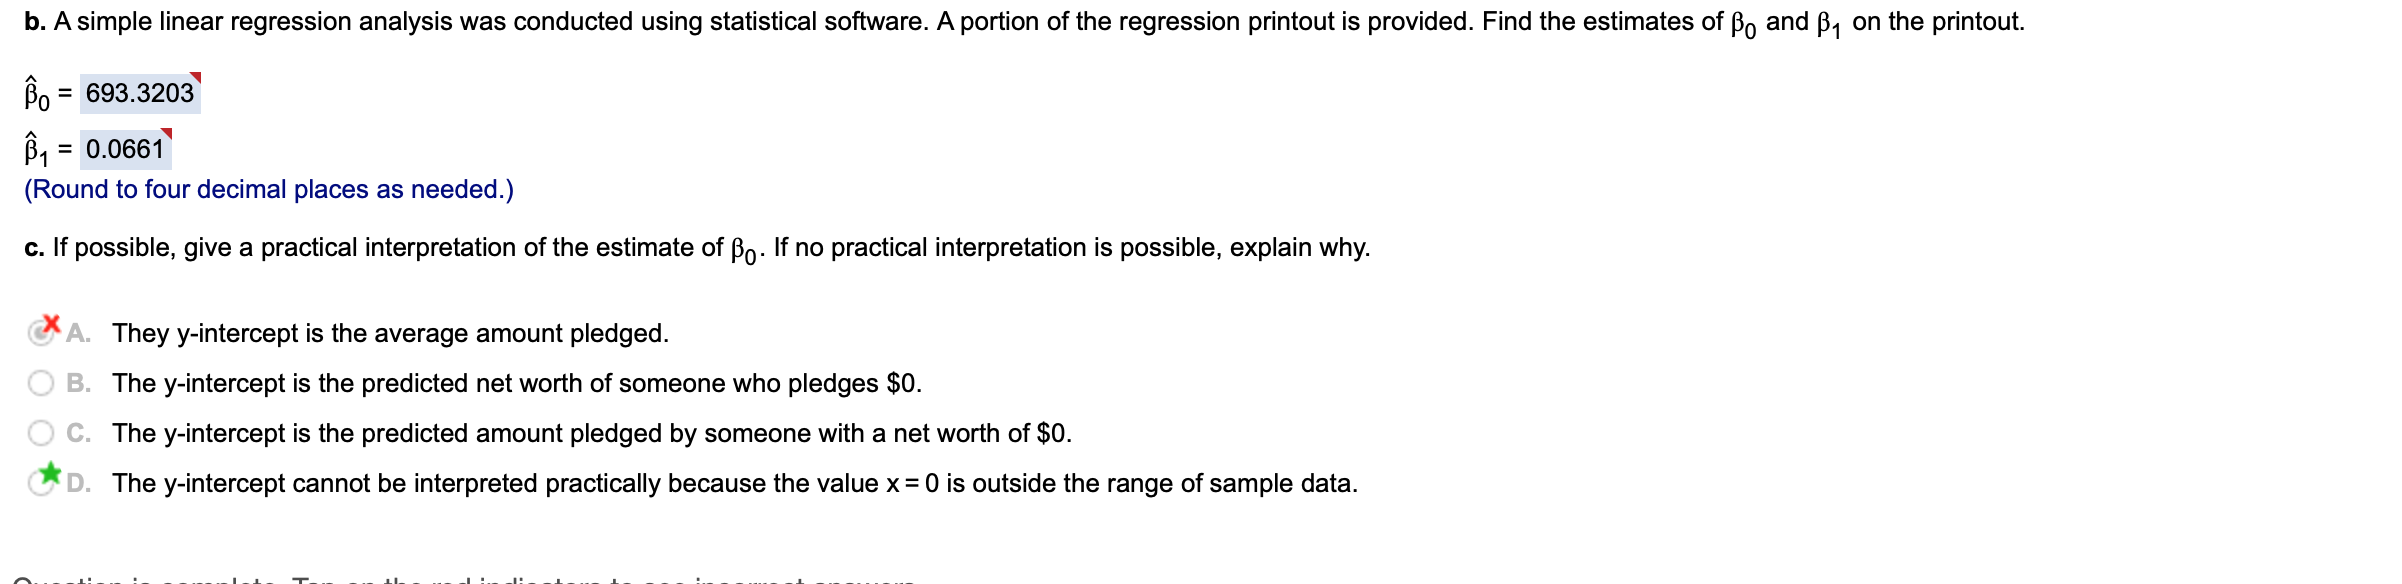
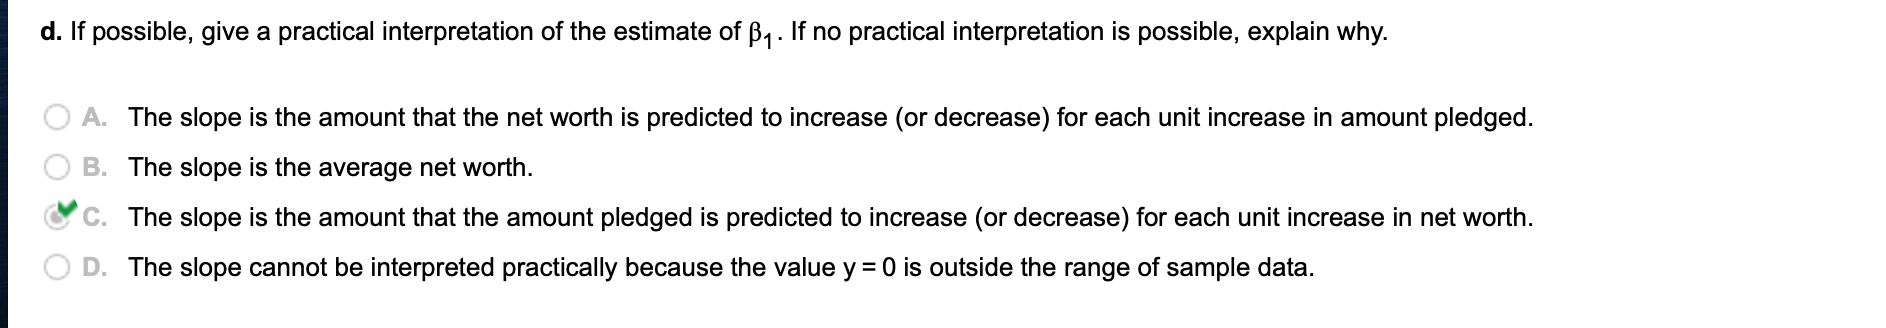
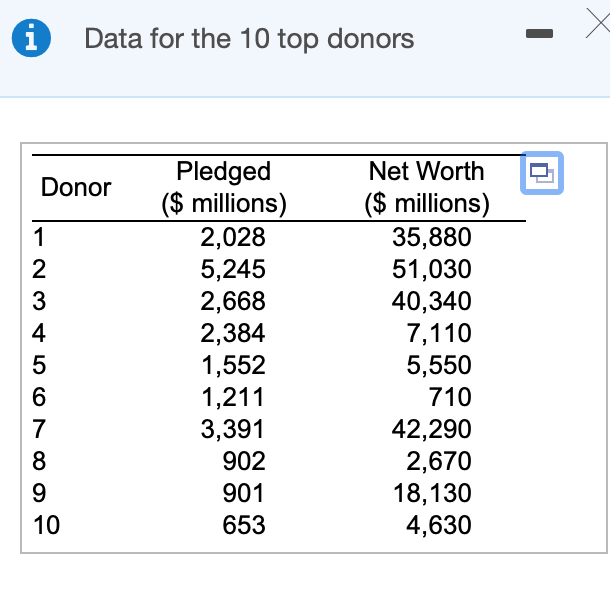
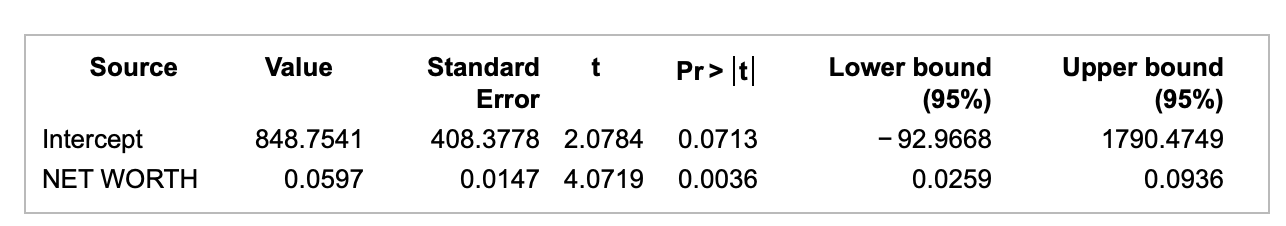
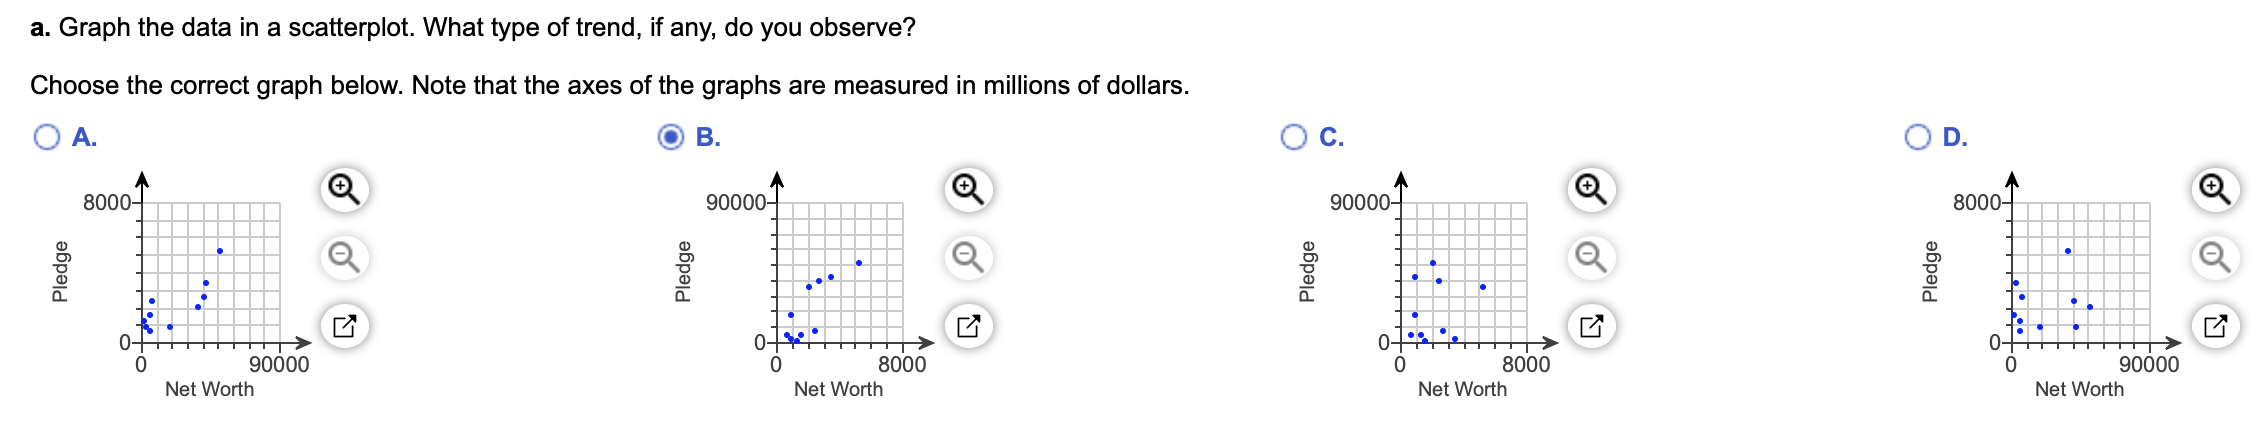
b. Asimple linear regression analysis was conducted using statistical software. A portion of the regression printout is provided. Find the estimates of [30 and [$1 on the printout. 60 = 693.3203' ['31 = 0.0661' (Round to four decimal places as needed.) c. If possible, give a practical interpretation of the estimate of [30. If no practical interpretation is possible, explain why. xx A. They y-interoept is the average amount pledged. B. The y-intercept is the predicted net worth of someone who pledges $0. C. The y-interoept is the predicted amount pledged by someone with a net worth of $0. * D. The y-interoept cannot be interpreted practically because the value x = 0 is outside the range of sample data. A,,,,.s,, :, \"WW-,1, -.-,,, ,, .L, ,,,.-,,.-,,1,,,, A, H, s,,,,,,,,. ,,,,,,,,,, d. If possible, give a practical interpretation of the estimate of [31. If no practical interpretation is possible, explain why. A. The slope is the amount that the net worth is predicted to increase (or decrease) for each unit increase in amount pledged. B. The slope is the average net worth. -" C. The slope is the amount that the amount pledged is predicted to increase (or decrease) for each unit increase in net worth. D. The slope cannot be interpreted practically because the value y = 0 is outside the range of sample data. 0 Data for the 10 top donors - > It| Lower bound Upper bound Error (95%) (95%) Intercept 848.7541 408.3778 2.0784 0.0713 - 92.9668 1790.4749 NET WORTH 0.0597 0.0147 4.0719 0.0036 0.0259 0.0936a. Graph the data in a scatterplot. What type of trend, if any, do you observe? Choose the correct graph below. Note that the axes of the graphs are measured in millions of dollars. O A. 7\\ 800 (g) I) I g , Q \" = " 0 l ... > \\g/ 0 90000 Net Worth (93. Pledge 90000 0 0 8000 Net Worth @ O C. /' 90000 \\9')' a) m 3 9x a "\\ , 0 ' (\\E'J 0 8000 Net Worth O D. /'\\ 8000 '8) d) l c: E Q n. 0 c_ //77\\ 1 l 2' 0.21 r n .49) 0 90000 Networth
Step by Step Solution
There are 3 Steps involved in it

Get step-by-step solutions from verified subject matter experts