

Question: I need step by step answers & interpretation by using R studio software . Data set can be found in R studio. Package: Sleuth 3
I need step by step answers & interpretation by using R studio software.
Data set can be found in R studio.
Package: Sleuth 3
ex1014
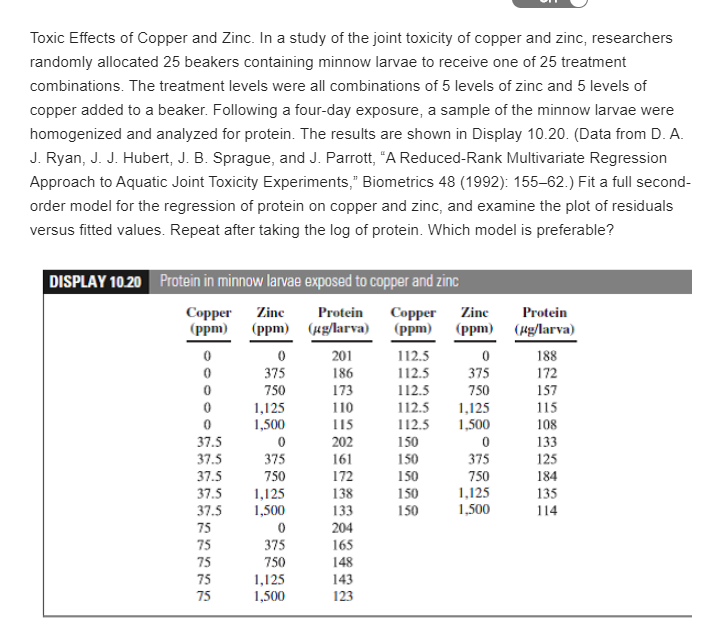
Toxic Effects of Copper and Zinc. In a study of the joint toxicity of copper and zinc, researchers randomly allocated 25 beakers containing minnow larvae to receive one of 25 treatment combinations. The treatment levels were all combinations of 5 levels of zinc and 5 levels of copper added to a beaker. Following a four-day exposure, a sample of the minnow larvae were homogenized and analyzed for protein. The results are shown in Display 10.20. (Data from D. A. J. Ryan, J. J. Hubert, J. B. Sprague, and J. Parrott, "A Reduced-Rank Multivariate Regression Approach to Aquatic Joint Toxicity Experiments," Biometrics 48 (1992): 155-62.) Fit a full second- order model for the regression of protein on copper and zinc, and examine the plot of residuals versus fitted values. Repeat after taking the log of protein. Which model is preferable? DISPLAY 10.20 Protein in minnow larvae exposed to copper and zinc Copper Zinc Protein Copper Zinc Protein (ppm) (ppm) (g/larva) (ppm) (ppm) (Hg/larva) 0 0 201 112.5 0 188 0 375 186 112.5 375 172 0 750 173 112.5 750 157 0 1,125 110 112.5 1,125 115 0 1,500 115 112.5 1,500 108 37.5 0 202 150 0 133 37.5 375 150 375 125 37.5 750 172 150 750 184 37.5 1,125 138 150 1,125 37.5 1,500 133 150 1,500 114 75 0 204 75 375 75 750 148 75 1,125 143 75 1,500 123 161 135 165 Toxic Effects of Copper and Zinc. In a study of the joint toxicity of copper and zinc, researchers randomly allocated 25 beakers containing minnow larvae to receive one of 25 treatment combinations. The treatment levels were all combinations of 5 levels of zinc and 5 levels of copper added to a beaker. Following a four-day exposure, a sample of the minnow larvae were homogenized and analyzed for protein. The results are shown in Display 10.20. (Data from D. A. J. Ryan, J. J. Hubert, J. B. Sprague, and J. Parrott, "A Reduced-Rank Multivariate Regression Approach to Aquatic Joint Toxicity Experiments," Biometrics 48 (1992): 155-62.) Fit a full second- order model for the regression of protein on copper and zinc, and examine the plot of residuals versus fitted values. Repeat after taking the log of protein. Which model is preferable? DISPLAY 10.20 Protein in minnow larvae exposed to copper and zinc Copper Zinc Protein Copper Zinc Protein (ppm) (ppm) (g/larva) (ppm) (ppm) (Hg/larva) 0 0 201 112.5 0 188 0 375 186 112.5 375 172 0 750 173 112.5 750 157 0 1,125 110 112.5 1,125 115 0 1,500 115 112.5 1,500 108 37.5 0 202 150 0 133 37.5 375 150 375 125 37.5 750 172 150 750 184 37.5 1,125 138 150 1,125 37.5 1,500 133 150 1,500 114 75 0 204 75 375 75 750 148 75 1,125 143 75 1,500 123 161 135 165
Step by Step Solution
There are 3 Steps involved in it

Get step-by-step solutions from verified subject matter experts