

Question: I need steps and guides on how to graph. Monster, Inc. produces laughs using the production function q = L21 5K 2 where q is
I need steps and guides on how to graph.
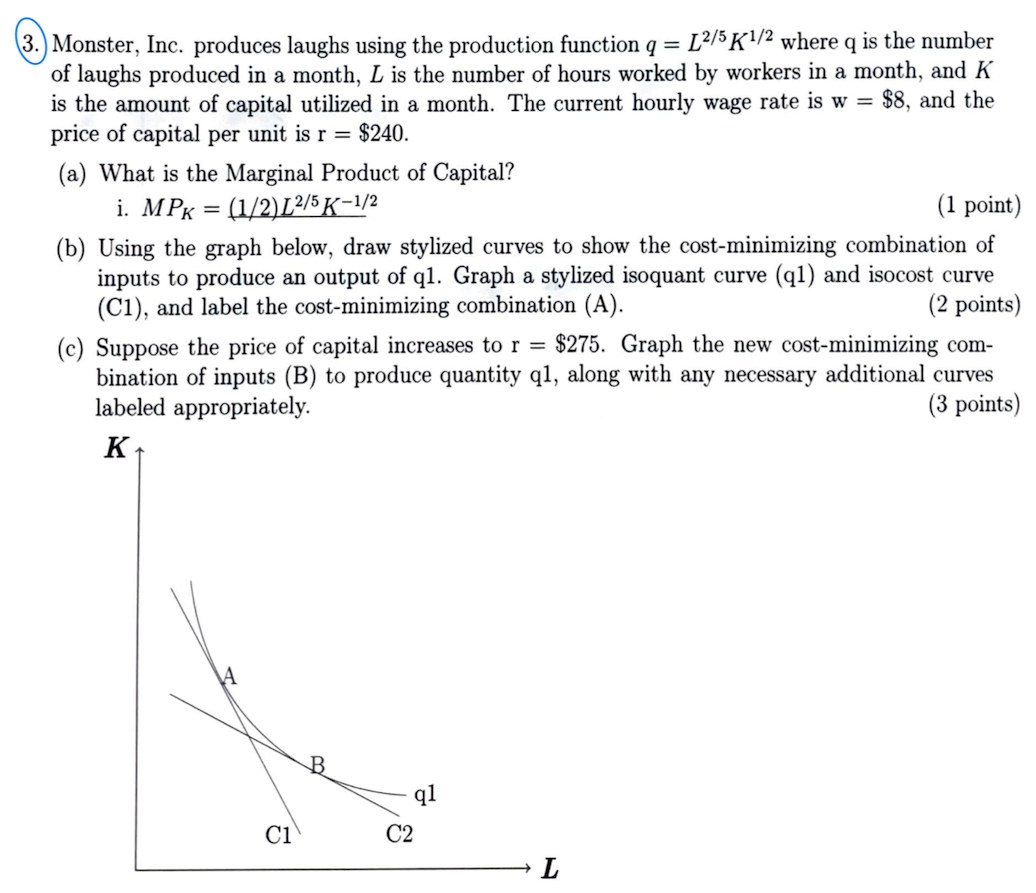
Monster, Inc. produces laughs using the production function q = L21 5K \"2 where q is the number of laughs produced in a month, L is the number of hours worked by workers in a month, and K is the amount of capital utilized in a month. The current hourly wage rate is w = $8, and the price of capital per unit is r = $240. (a) What is the Marginal Product of Capital? 1. Mpg = W2 (1 point) (b) Using the graph below, draw stylized curves to show the cost-minimizing combination of inputs to produce an output of ql. Graph a stylized isoquant curve (ql) and isocost curve (Cl), and label the cost-minimizing combination (A). (2 points) (c) Suppose the price of capital increases to r = $275. Graph the new cost-minimizing com- bination of inputs (B) to produce quantity ql, along with any necessary additional curves labeled appropriately. (3 points) K C1 C2
Step by Step Solution
There are 3 Steps involved in it

Get step-by-step solutions from verified subject matter experts