

Question: 1. Sketch a diagram for the experimental instrumentation and devices 2. State any possible error source in the experiment. 3. State any suggestions to
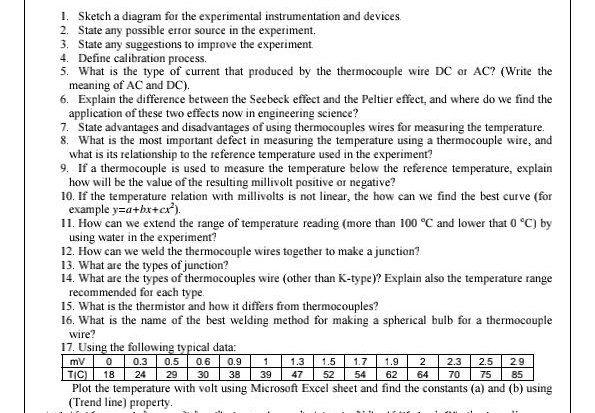
1. Sketch a diagram for the experimental instrumentation and devices 2. State any possible error source in the experiment. 3. State any suggestions to improve the experiment. 4. Define calibration process. 5. What is the type of current that produced by the thermocouple wire DC or AC? (Write the meaning of AC and DC). 6. Explain the difference between the Seebeck effect and the Peltier effect, and where do we find the application of these two effects now in engineering science? 7. State advantages and disadvantages of using thermocouples wires for measuring the temperature. 8. What is the most important defect in measuring the temperature using a thermocouple wire, and what is its relationship to the reference temperature used in the experiment? 9. If a thermocouple is used to measure the temperature below the reference temperature, explain how will be the value of the resulting millivolt positive or negative? 10. If the temperature relation with millivolts is not linear, the how can we find the best curve (for example y=a+bx+cx). 11. How can we extend the range of temperature reading (more than 100 C and lower that 0 C) by using water in the experiment? 12. How can we weld the thermocouple wires together to make a junction? 13. What are the types of junction? 14. What are the types of thermocouples wire (other than K-type)? Explain also the temperature range recommended for each type. 15. What is the thermistor and how it differs from thermocouples? 16. What is the name of the best welding method for making a spherical bulb for a thermocouple wire? 17. Using the following typical data: mV 0 TIC) 18 1 1.3 1.5 1.7 1.9 2.9 85 0.3 0.5 0.6 0.9 2 2.3 2.5 24 29 30 38 39 47 52 54 62 64 70 75 Plot the temperature with volt using Microsoft Excel sheet and find the constants (a) and (b) using (Trend line) property.
Step by Step Solution
3.50 Rating (177 Votes )
There are 3 Steps involved in it
1 ANS Sketch a diagram for the experimental instrumentation and devices 2 ANS Possible error source the experiment Common sources of error include instrumental environmental procedural and human All o... View full answer

Get step-by-step solutions from verified subject matter experts