

Question: The following table contains some data showing the effect of molar concentration of a solution on the absorbance (optical density) reading from a spectrophotometer.
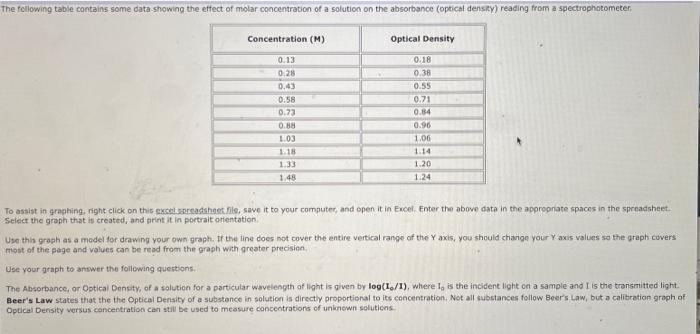
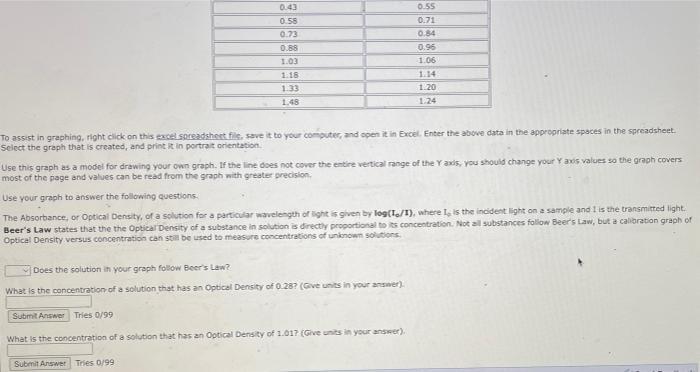
The following table contains some data showing the effect of molar concentration of a solution on the absorbance (optical density) reading from a spectrophotometer. Concentration (M) 0.13 0.28 0.43 0.58 0.73 0.88 1.03 1.18 1.33 1.48 IN Optical Density 0.18 0.38 0.55 0.71 0.84 0.96 1.06 1.14 1.20 1.24 To assist in graphing, right click on this excel.spreadsheet file, save it to your computer, and open it in Excel. Enter the above data in the appropriate spaces in the spreadsheet. Select the graph that is created, and print it in portrait orientation. Use this graph as a model for drawing your own graph. If the line does not cover the entire vertical range of the Y axis, you should change your Y axis values so the graph covers. most of the page and values can be read from the graph with greater precision. Use your graph to answer the following questions. The Absorbance, or Optical Density, of a solution for a particular wavelength of light is given by log(1/1), where I, is the incident light on a sample and I is the transmitted light. Beer's Law states that the the Optical Density of a substance in solution is directly proportional to its concentration. Not all substances follow Beer's Law, but a calibration graph of Optical Density versus concentration can still be used to measure concentrations of unknown solutions. 0.43 0.58 0.73 0.88 1.03 1.18 1.33 1.48 To assist in graphing, right click on this excel spreadsheet file, save it to your computer, and open it in Excel. Enter the above data in the appropriate spaces in the spreadsheet. Select the graph that is created, and print it in portrait orientation. 0.55 0.71 0.84 0.96 1.06 1.14 1.20 1.24 Use this graph as a model for drawing your own graph. If the line does not cover the entire vertical range of the Y axis, you should change your Y axis values so the graph covers most of the page and values can be read from the graph with greater precision. Use your graph to answer the following questions. The Absorbance, or Optical Density, of a solution for a particular wavelength of light is given by log(1/1), where I, is the incident light on a sample and I is the transmitted light. Beer's Law states that the the Optical Density of a substance in solution is directly proportional to its concentration. Not all substances follow Beer's Law, but a calibration graph of Optical Density versus concentration can still be used to measure concentrations of unknown solutions. Does the solution in your graph follow Beer's Law? What is the concentration of a solution that has an Optical Density of 0.28? (Give units in your answer). Submit Answer Tries 0/99 What is the concentration of a solution that has an Optical Density of 1.017 (Give units in your answer). Submit Answer Tries 0/99
Step by Step Solution
3.32 Rating (158 Votes )
There are 3 Steps involved in it
To determine if the solution follows Beers Law we need to check if the relatio... View full answer

Get step-by-step solutions from verified subject matter experts