

Question: I need the answer for C and D only 102-011 Delays at Logan Airport Exhibit 8 Comparison of August Weekday Peaking Patterns1995 vs. 2000 (Capacity
I need the answer for C and D only
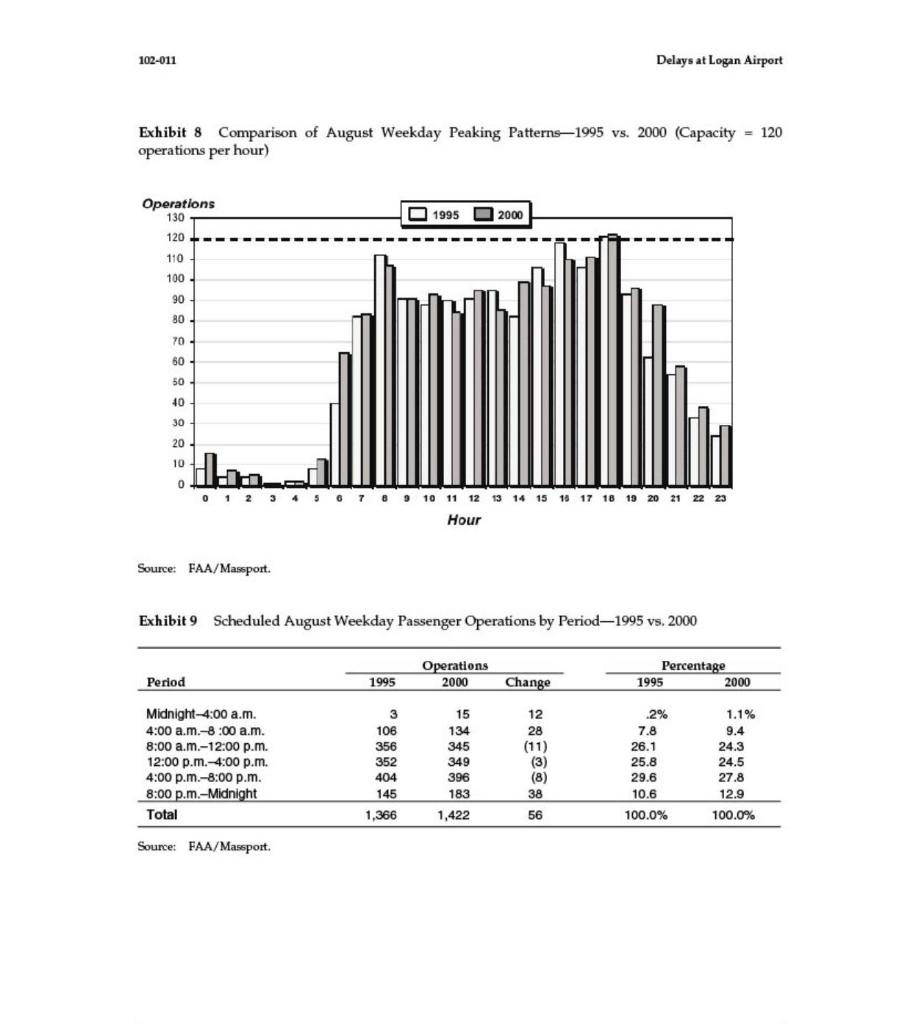
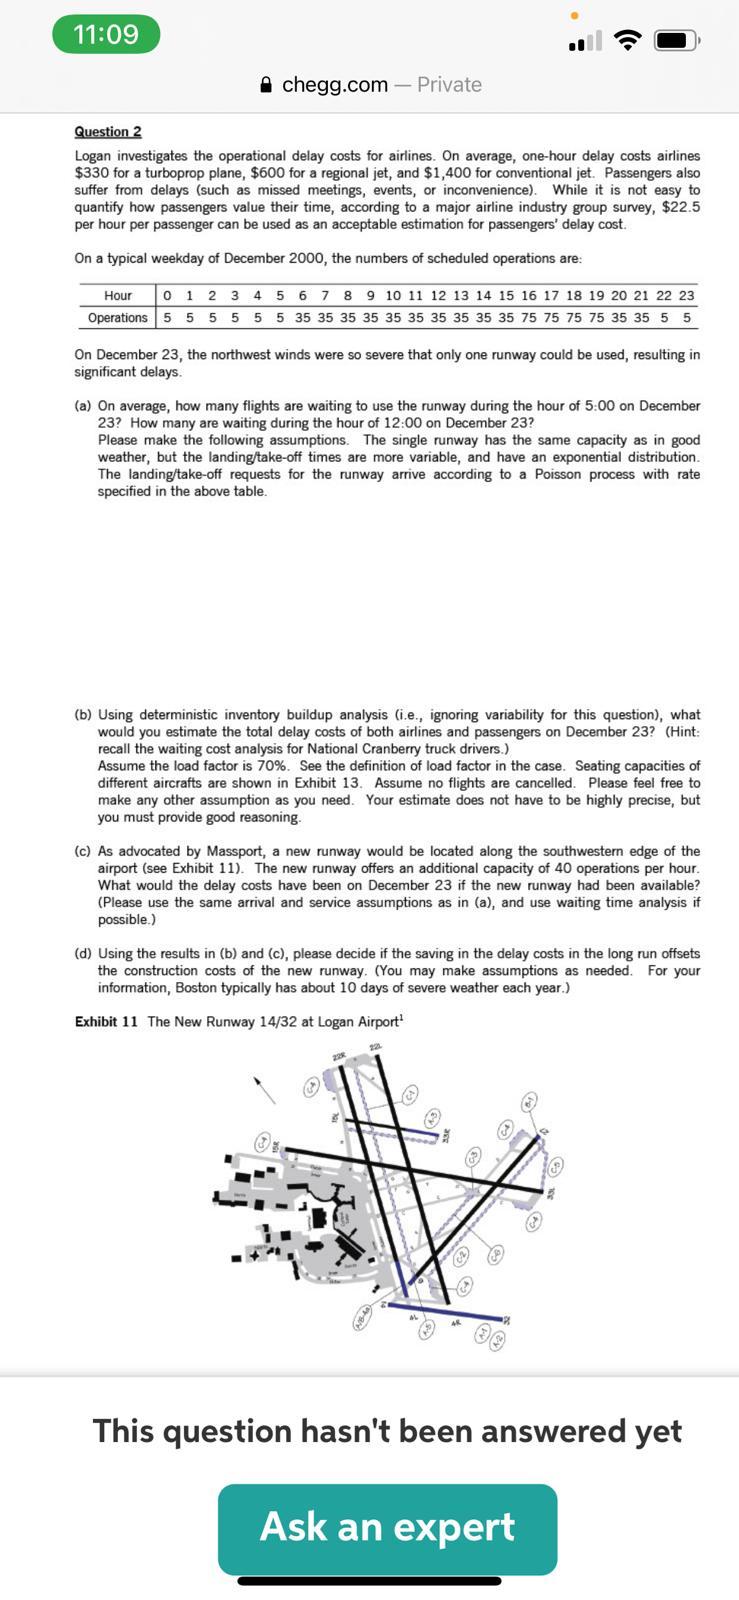
102-011 Delays at Logan Airport Exhibit 8 Comparison of August Weekday Peaking Patterns1995 vs. 2000 (Capacity = 120 operations per hour) Operations 130 1995 2000 120 110 100 90 80 70 60 50 40 30 20 10 haded 0 3 4 5 6 7 8 9 10 11 12 13 14 15 16 17 18 19 20 21 22 23 Hour Source: FAA/Massport. Exhibit 9 Scheduled August Weekday Passenger Operations by Period1995 vs. 2000 Operations 2000 Period 1995 Change Percentage 1995 2000 3 106 Midnight-4:00 a.m. 4:00 a.m.-8:00 a.m. 8. 8:00 a.m.-12:00 p.m. 12:00 p.m. 4:00 p.m. 4:00 p.m.-8:00p.m. 8:00 p.m.-Midnight Total 356 352 404 145 15 134 345 349 396 183 1,422 12 28 (11) (3) 8 38 56 2% 7.8 26.1 25.8 29.6 10.6 100.0% 1.1% 9.4 24.3 24.5 27.8 12.9 100.0% 1,366 Source: FAA/Massport 11:09 chegg.com - Private Question 2 Logan investigates the operational delay costs for airlines. On average, one-hour delay costs airlines $330 for a turboprop plane, $600 for a regional jet, and $1,400 for conventional jet. Passengers also suffer from delays (such as missed meetings, events, or inconvenience) While it is not easy to quantify how passengers value their time, according to a major airline industry group survey, $22.5 per hour per passenger can be used as an acceptable estimation for passengers' delay cost. On a typical weekday of December 2000, the numbers of scheduled operations are: Hour 0 1 2 3 4 5 6 7 8 9 10 11 12 13 14 15 16 17 18 19 20 21 22 23 Operations 5 5 5 5 5 5 35 35 35 35 35 35 35 35 35 35 75 75 75 75 35 35 5 5 On December 23, the northwest winds were so severe that only one runway could be used, resulting in significant delays. (a) On average, how many flights are waiting to use the runway during the hour of 5:00 on December 23? How many are waiting during the hour of 12:00 on December 23? Please make the following assumptions. The single runway has the same capacity as in good weather, but the landing/take-off times are more variable, and have an exponential distribution The landing take-off requests for the runway arrive according to a Poisson process with rate specified in the above table. (b) Using deterministic inventory buildup analysis (i.e., ignoring variability for this question), what would you estimate the total delay costs of both airlines and passengers on December 23? (Hint: recall the waiting cost analysis for National Cranberry truck drivers.) Assume the load factor is 70%. See the definition of load factor in the case. Seating capacities of different aircrafts are shown in Exhibit 13. Assume no flights are cancelled. Please feel free to make any other assumption as you need. Your estimate does not have to be highly precise, but you must provide good reasoning. (c) As advocated by Massport, a new runway would be located along the southwestern edge of the airport (see Exhibit 11). The new runway offers an additional capacity of 40 operations per hour. What would the delay costs have been on December 23 if the new runway had been available? (Please use the same arrival and service assumptions as in (a), and use waiting time analysis if possible.) (d) Using the results in (b) and (c), please decide if the saving in the delay costs in the long run offsets the construction costs of the new runway. (You may make assumptions as needed. For your information, Boston typically has about 10 days of severe weather each year.) Exhibit 11 The New Runway 14/32 at Logan Airport! To This question hasn't been answered yet Ask an expertStep by Step Solution
There are 3 Steps involved in it
1 Expert Approved Answer
Step: 1 Unlock

Question Has Been Solved by an Expert!
Get step-by-step solutions from verified subject matter experts
Step: 2 Unlock
Step: 3 Unlock