

Question: I need the answer only without explanation What is a control chart that monitors changes in the mean value of a process? Select one: a.
I need the answer only without explanation 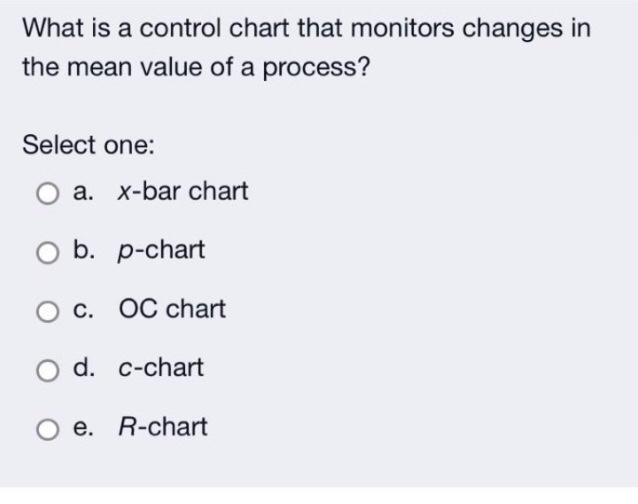
What is a control chart that monitors changes in the mean value of a process? Select one: a. X-bar chart a- b. p-chart . c. OC chart d. C-chart O e. R-chart Step by Step Solution
There are 3 Steps involved in it
1 Expert Approved Answer
Step: 1 Unlock

Question Has Been Solved by an Expert!
Get step-by-step solutions from verified subject matter experts
Step: 2 Unlock
Step: 3 Unlock