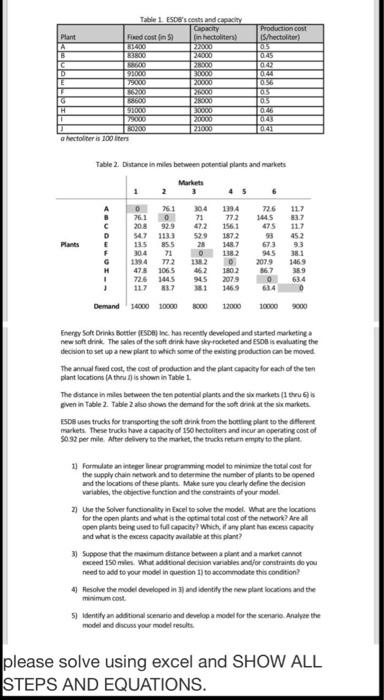
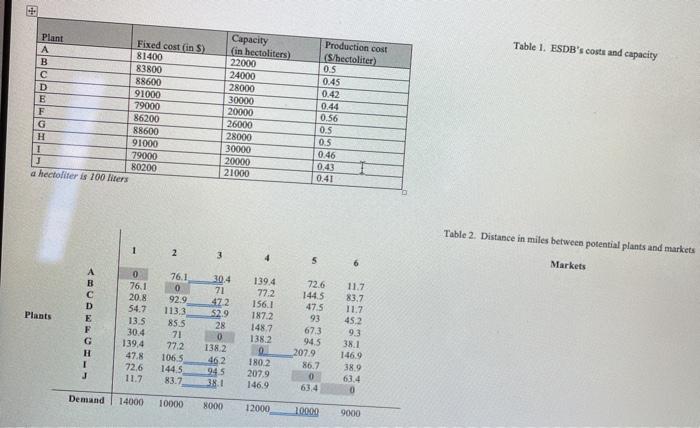
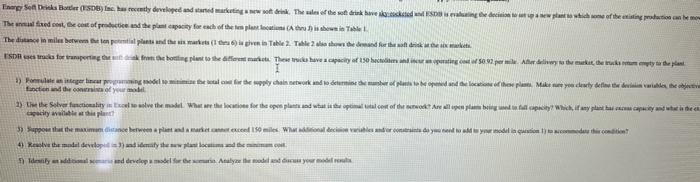
Question: I need the answer to question 5 specifically Table 1 Escorts and capacity Capacity Fixed cost in in hectoliters 2200 33800 Production cost IS hector)

I need the answer to question 5 specifically
Table 1 Escorts and capacity Capacity Fixed cost in in hectoliters 2200 33800 Production cost IS hector) 05 0745 Plant A B C D E CH 2900 2000 20000 6 H 0136 05 03 08 04 200 30000 120000 PO 91000 79000 hector is 100 liters 1194 Table 2. Distance in miles between potential plants and markets Markets 2 3 6 A 0 761 304 226 7610 71 772 1445 2018 92.9 472 1561 475 117 D 547 1133 529 1872 452 E 135 855 148. 673 93 F 304 71 0 1382 945 381 G 1394 772 1382 0 2079 1469 478 1065 726 3445 945 2079 O 63.4 117 17 1469 1802 359 Demand 14000 10000 2000 12000 Energy Soft Drink Bottler ( Enchas recently developed and started marketing new soft drink. The sales of the soft drink have skyrocketed and EB is evaluating the decision to set up a new plant to which some of the existing production can be moved The annual feed cost, the cost of production and the plant capacity for each of the ten plant locations A thuis shown in Table 1 The distance in mles between the ten potential plants and the six markets (16) even in Table 2. Table 2 to show the demand for the soft drink at the markets ESD uses trucks for transporting the soft drink from the botting plant to the different markets. These trucks have a capacity of 150 hectoliters and incur an operating cost of 5092 per mi. Alter delivery to the market, the trucks return empty to the plant. 1) Formulate an integer linear programming model to minimize the total cost for the supply chain network and to determine the number of plants to be opened and the locations of these plants. Make sure you clearly define the decision variables, the objective function and the constraints of your model 2) Use the Solver functionality in Excel to solve the model. What are the locations for the open plants and what is the optimal total cost of the network? Areal open plants being used to capacity? Which plants RSS CITY and what is the excess capacity available at this plant? 3) Suppose that the maximum distance between a plant and a market and exceed 150 miles. What additional decision variables and/or constraints do you need to add to your model in question 1) to accommodate this condition? 4 Resolve the model developed in 3) and identify the new plant locations and the minimum cost dentity an additional scenario and develop a model for the scenario. Analyze the model and discuss your model results please solve using excel and SHOW ALL STEPS AND EQUATIONS. Hieno So Drink Bottles (RSD) Tely developed and can being. The feet teve kocked and wing tutoriale at ww plant is lichte of the existing protection can be mad. Theredt, Be cooption and the play for each of the place (Table The mean the prental plan was the prema 2. lehem was drink Ekstumpering the word ook from the engine at the capacity of 150 hold reporting at our 300 per millor eliby w when the southeast 1) Pompin Why dan terus da determine the number of bedden en Malere you clearly define te doen watin, the chinting 3) the the folder where we are to the page and little point to complete wwwyuki wypluthum pynt what the com We w you do Nese depois www.my hthofy hammer Table 1. ESDB's costs and capacity Plant Fixed cost in S) A 81400 B 83800 88600 D 91000 E 79000 F 86200 G 88600 91000 1 79000 J 80200 a hectoliter is 100 liters Capacity (in hectoliters) 22000 24000 28000 30000 20000 26000 28000 30000 20000 21000 Production cost (S/hectoliter) OS 0.45 0.42 0.44 0.56 0.5 0.5 046 0.43 0.41 Table 2. Distance in miles between potential plants and markets 1 2 3 4 5 6 Markets 30.4 71 11.7 47.2 72.6 1445 475 93 83.7 Plants 0 76.1 20.8 54.7 13.5 30.4 139,4 47.8 72.6 11.7 D E F G H 1 J 76.1 0 92.9 113.3 85.5 -71 77.2 106.5 144.5 83.7 67.3 1394 772 156.1 1872 1487 138.2 0 1802 2079 146.9 $2.9 28 0 1382 462 945 38.1 945 207.9 86.7 0 63.4 11.7 45.2 9.3 381 1469 38.9 63.4 0 Demand 14000 10000 8000 12000 10000 9000 Tinere Sonds Botlet (186) Inc. Les recently developed and stand marketing work. The sale of the met dit hoved She deci of the sale The anat fixed cost, se cost of production and the plant experty for each of the templates (Athin shows in The The distance in milu betwem hetten perential and the market (1) Table 2 Table 2 the war In sector wraporting them in the hosting plant to be different market. The des have a capacity of 10 5093.per. After water the 1) Formular minimize the low chain network and to desde hep Make your desty w whe faction and they 1) The Solver unctionality to live the model. What are the line o de pe plantet in the upamtitle of the total pod prywich, y pues com capacity and the capacity www 3 out that the maximum de bewone place 10 miles Where come day My model withicon 4 vite dal developed and the last locum the dely and developmodel Sur Analyze the model on your Table 1 Escorts and capacity Capacity Fixed cost in in hectoliters 2200 33800 Production cost IS hector) 05 0745 Plant A B C D E CH 2900 2000 20000 6 H 0136 05 03 08 04 200 30000 120000 PO 91000 79000 hector is 100 liters 1194 Table 2. Distance in miles between potential plants and markets Markets 2 3 6 A 0 761 304 226 7610 71 772 1445 2018 92.9 472 1561 475 117 D 547 1133 529 1872 452 E 135 855 148. 673 93 F 304 71 0 1382 945 381 G 1394 772 1382 0 2079 1469 478 1065 726 3445 945 2079 O 63.4 117 17 1469 1802 359 Demand 14000 10000 2000 12000 Energy Soft Drink Bottler ( Enchas recently developed and started marketing new soft drink. The sales of the soft drink have skyrocketed and EB is evaluating the decision to set up a new plant to which some of the existing production can be moved The annual feed cost, the cost of production and the plant capacity for each of the ten plant locations A thuis shown in Table 1 The distance in mles between the ten potential plants and the six markets (16) even in Table 2. Table 2 to show the demand for the soft drink at the markets ESD uses trucks for transporting the soft drink from the botting plant to the different markets. These trucks have a capacity of 150 hectoliters and incur an operating cost of 5092 per mi. Alter delivery to the market, the trucks return empty to the plant. 1) Formulate an integer linear programming model to minimize the total cost for the supply chain network and to determine the number of plants to be opened and the locations of these plants. Make sure you clearly define the decision variables, the objective function and the constraints of your model 2) Use the Solver functionality in Excel to solve the model. What are the locations for the open plants and what is the optimal total cost of the network? Areal open plants being used to capacity? Which plants RSS CITY and what is the excess capacity available at this plant? 3) Suppose that the maximum distance between a plant and a market and exceed 150 miles. What additional decision variables and/or constraints do you need to add to your model in question 1) to accommodate this condition? 4 Resolve the model developed in 3) and identify the new plant locations and the minimum cost dentity an additional scenario and develop a model for the scenario. Analyze the model and discuss your model results please solve using excel and SHOW ALL STEPS AND EQUATIONS. Hieno So Drink Bottles (RSD) Tely developed and can being. The feet teve kocked and wing tutoriale at ww plant is lichte of the existing protection can be mad. Theredt, Be cooption and the play for each of the place (Table The mean the prental plan was the prema 2. lehem was drink Ekstumpering the word ook from the engine at the capacity of 150 hold reporting at our 300 per millor eliby w when the southeast 1) Pompin Why dan terus da determine the number of bedden en Malere you clearly define te doen watin, the chinting 3) the the folder where we are to the page and little point to complete wwwyuki wypluthum pynt what the com We w you do Nese depois www.my hthofy hammer Table 1. ESDB's costs and capacity Plant Fixed cost in S) A 81400 B 83800 88600 D 91000 E 79000 F 86200 G 88600 91000 1 79000 J 80200 a hectoliter is 100 liters Capacity (in hectoliters) 22000 24000 28000 30000 20000 26000 28000 30000 20000 21000 Production cost (S/hectoliter) OS 0.45 0.42 0.44 0.56 0.5 0.5 046 0.43 0.41 Table 2. Distance in miles between potential plants and markets 1 2 3 4 5 6 Markets 30.4 71 11.7 47.2 72.6 1445 475 93 83.7 Plants 0 76.1 20.8 54.7 13.5 30.4 139,4 47.8 72.6 11.7 D E F G H 1 J 76.1 0 92.9 113.3 85.5 -71 77.2 106.5 144.5 83.7 67.3 1394 772 156.1 1872 1487 138.2 0 1802 2079 146.9 $2.9 28 0 1382 462 945 38.1 945 207.9 86.7 0 63.4 11.7 45.2 9.3 381 1469 38.9 63.4 0 Demand 14000 10000 8000 12000 10000 9000 Tinere Sonds Botlet (186) Inc. Les recently developed and stand marketing work. The sale of the met dit hoved She deci of the sale The anat fixed cost, se cost of production and the plant experty for each of the templates (Athin shows in The The distance in milu betwem hetten perential and the market (1) Table 2 Table 2 the war In sector wraporting them in the hosting plant to be different market. The des have a capacity of 10 5093.per. After water the 1) Formular minimize the low chain network and to desde hep Make your desty w whe faction and they 1) The Solver unctionality to live the model. What are the line o de pe plantet in the upamtitle of the total pod prywich, y pues com capacity and the capacity www 3 out that the maximum de bewone place 10 miles Where come day My model withicon 4 vite dal developed and the last locum the dely and developmodel Sur Analyze the model on your

Step by Step Solution

There are 3 Steps involved in it

1 Expert Approved Answer
Step: 1 Unlock blur-text-image
Question Has Been Solved by an Expert!

Get step-by-step solutions from verified subject matter experts

Step: 2 Unlock
Step: 3 Unlock

Students Have Also Explored These Related General Management Questions!