

Question: I need the Excel sheet with all this information on it and with the steps that are needed to be completed. To compute the holding
I need the Excel sheet with all this information on it and with the steps that are needed to be completed.
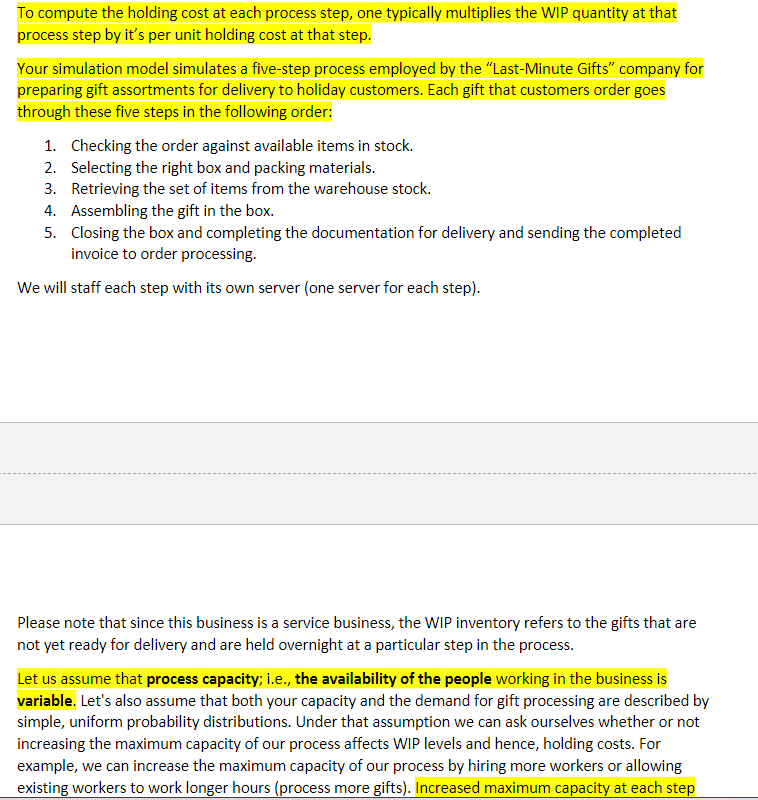
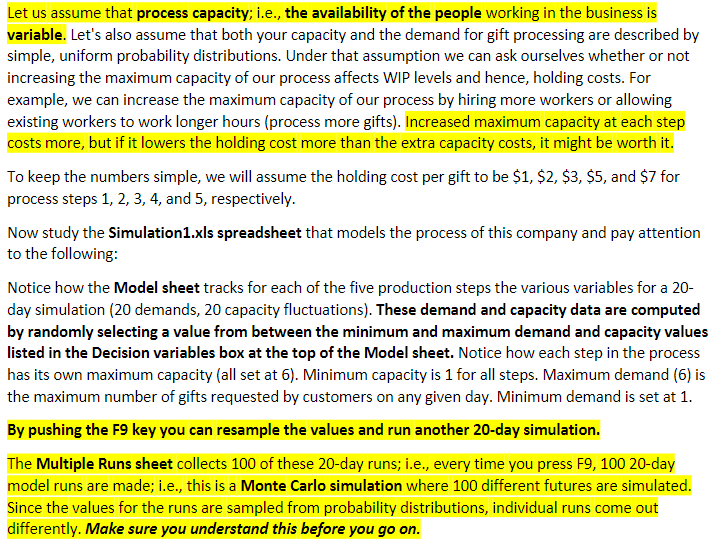
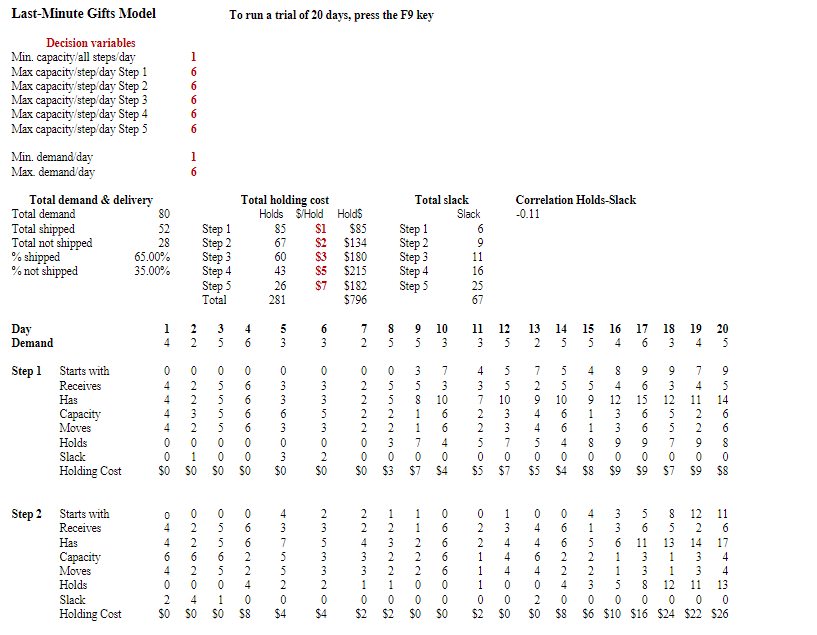
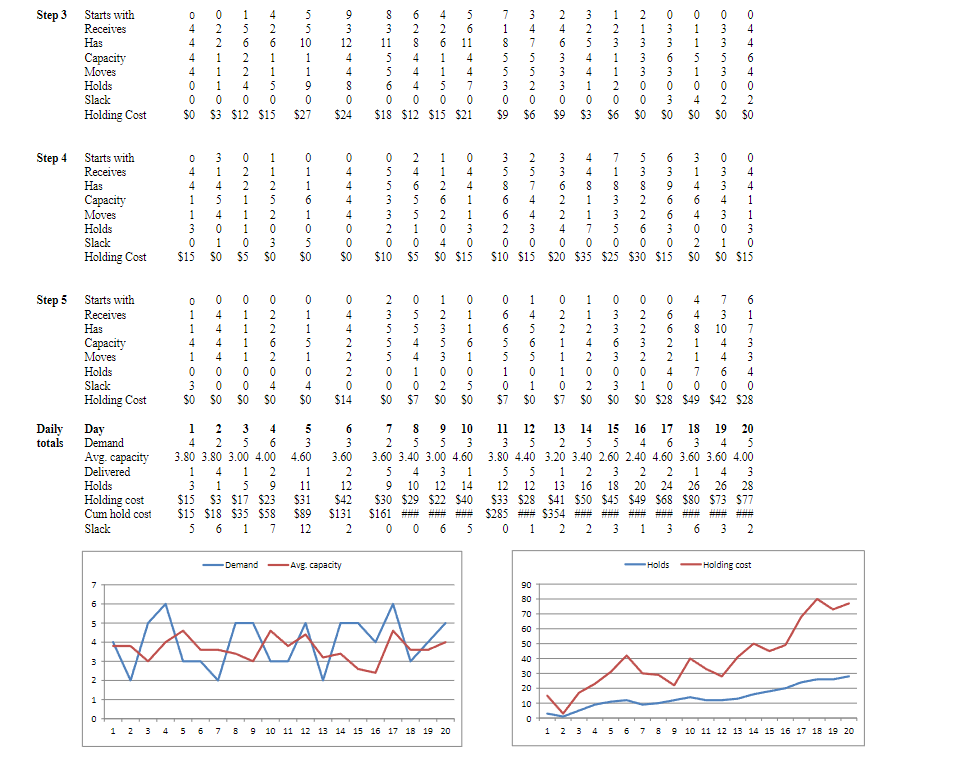
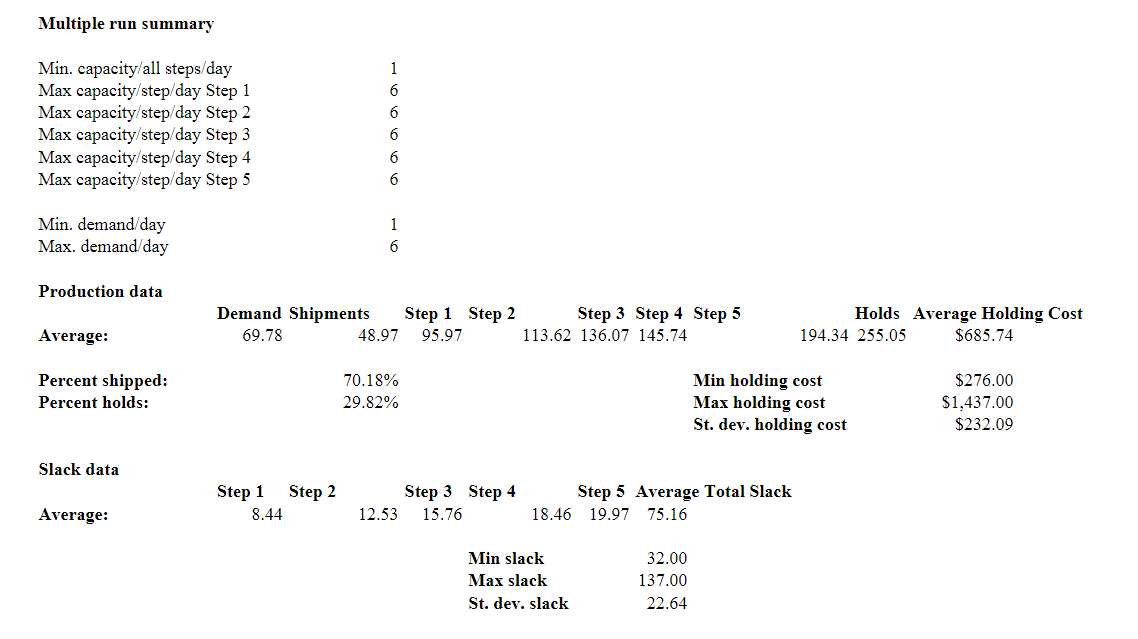
To compute the holding cost at each process step, one typically multiplies the WIP quantity at that process step by it's per unit holding cost at that step. Your simulation model simulates a five-step process employed by the "Last-Minute Gifts" company for preparing gift assortments for delivery to holiday customers. Each gift that customers order goes through these five steps in the following order: 1. Checking the order against available items in stock. 2. Selecting the right box and packing materials. 3. Retrieving the set of items from the warehouse stock. 4. Assembling the gift in the box. 5. Closing the box and completing the documentation for delivery and sending the completed invoice to order processing. We will staff each step with its own server (one server for each step). Please note that since this business is a service business, the WIP inventory refers to the gifts that are not yet ready for delivery and are held overnight at a particular step in the process. Let us assume that process capacity; i.e., the availability of the people working in the business is variable. Let's also assume that both your capacity and the demand for gift processing are described by simple, uniform probability distributions. Under that assumption we can ask ourselves whether or not increasing the maximum capacity of our process affects WIP levels and hence, holding costs. For example, we can increase the maximum capacity of our process by hiring more workers or allowing existing workers to work longer hours (process more gifts). Increased maximum capacity at each step Let us assume that process capacity; i.e., the availability of the people working in the business is variable. Let's also assume that both your capacity and the demand for gift processing are described by simple, uniform probability distributions. Under that assumption we can ask ourselves whether or not increasing the maximum capacity of our process affects WIP levels and hence, holding costs. For example, we can increase the maximum capacity of our process by hiring more workers or allowing existing workers to work longer hours (process more gifts). Increased maximum capacity at each step costs more, but if it lowers the holding cost more than the extra capacity costs, it might be worth it. To keep the numbers simple, we will assume the holding cost per gift to be $1,$2,$3, $5, and $7 for process steps 1,2,3,4, and 5 , respectively. Now study the Simulation1.xls spreadsheet that models the process of this company and pay attention to the following: Notice how the Model sheet tracks for each of the five production steps the various variables for a 20day simulation (20 demands, 20 capacity fluctuations). These demand and capacity data are computed by randomly selecting a value from between the minimum and maximum demand and capacity values listed in the Decision variables box at the top of the Model sheet. Notice how each step in the process has its own maximum capacity (all set at 6). Minimum capacity is 1 for all steps. Maximum demand (6) is the maximum number of gifts requested by customers on any given day. Minimum demand is set at 1. By pushing the F9 key you can resample the values and run another 20-day simulation. The Multiple Runs sheet collects 100 of these 20-day runs; i.e., every time you press F9, 100 20-day model runs are made; i.e., this is a Monte Carlo simulation where 100 different futures are simulated. Since the values for the runs are sampled from probability distributions, individual runs come out differently. Make sure you understand this before you go on. Last-Minute Gifts Model To run a trial of 20 days, press the F9 key Decision variables Min.capacity/allsteps/dayMaxcapacity/step/dayStep1Maxcapacity/step/dayStep2Maxcapacity/step/dayStep3Maxcapacity/step/dayStep4Maxcapacity/step/dayStep5166666 Min.demand/dayMaxdemand/day16 Step2StartswithReceivesHasCapacityMovesHoldsSlackHoldingCost0446402$00226204$00556501$00662240$84375520$42353320$42243310$21232210$21122200$00666600$00221110$21344400$00446402$00662240$84152230$63361150$1056113380$16851311120$241221433110$221161744130$26 Step3StartswithReceivesHasCapacityMovesHoldsSlackHoldingCost0444400$00221110$31562240$124261150$1555101190$27931244$0$2483115560$186284440$124261150$1556114470$217185530$93475520$62463330$93254410$31231120$62133300$00336303$00115104$00335302$00446402$0 Step4StartswithReceivesHasCapacityMovesHoldsSlackHoldingCost0441130$153145401$00221110$51125203$00116105$00444400$00553320$102465510$51126204$00441130$153586620$102574430$153362240$204481170$357183350$255382260$306396630$153146402$00334301$00441130$15 Multiple run summary Min. capacity/all steps/day Max capacity/step/day Step 16 Max capacity/step/day Step 26 Max capacity/step/day Step 36 Max capacity/step/day Step 46 Max capacity/step/day Step 56 Min. demand/day 1 Max. demand/day 6 Production data Average: Slack data Average
Step by Step Solution
There are 3 Steps involved in it

Get step-by-step solutions from verified subject matter experts