

Question: I need the format, please. Given below are annual data for total assets for Apple AAPL. and Coca Cola KO for the period 2010-2020 as
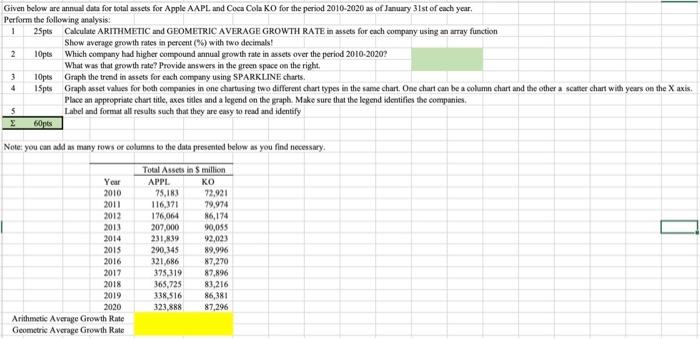
Given below are annual data for total assets for Apple AAPL. and Coca Cola KO for the period 2010-2020 as of January 31st of each year, Perform the following analysis 1 25pts Calculate ARITHMETIC and GEOMETRIC AVERAGE GROWTH RATE in assets for each company using an array function Show average growth rates in percent (%) with two decimals! 2 10pts Which company had higher compound annual growth rate in assets over the period 2010-2020? What was that growth rate? Provide answers in the green space on the right 3 10pts Graph the trend in assets for each company using S SPARKLINE charts. 4 15pts Graph asset values for both companies in one chartusing two different chart types in the same chart. One chart can be a column chart and the other a scatter chart with years on the X axis. Place an appropriate chart title, axes titles and a legend on the graph. Make sure that the legend identifies the companies 5 Label and format all results such that they are easy to read and identify 60pts Note: you can add as many rows or columns to the data presented below as you find necessary. Total Assets in S million Year APPL KO 2010 75,183 72,921 2011 116,371 79,974 2012 176,064 16,174 2013 207.000 90,055 2014 231,839 92,023 2015 290,345 89.996 2016 321,686 87,270 2017 375,319 87,896 2018 365,725 83.216 2019 338,516 86,381 2020 323.888 87,296 Arithmetic Average Growth Rate Geometric Average Growth Rate
Step by Step Solution
There are 3 Steps involved in it

Get step-by-step solutions from verified subject matter experts