

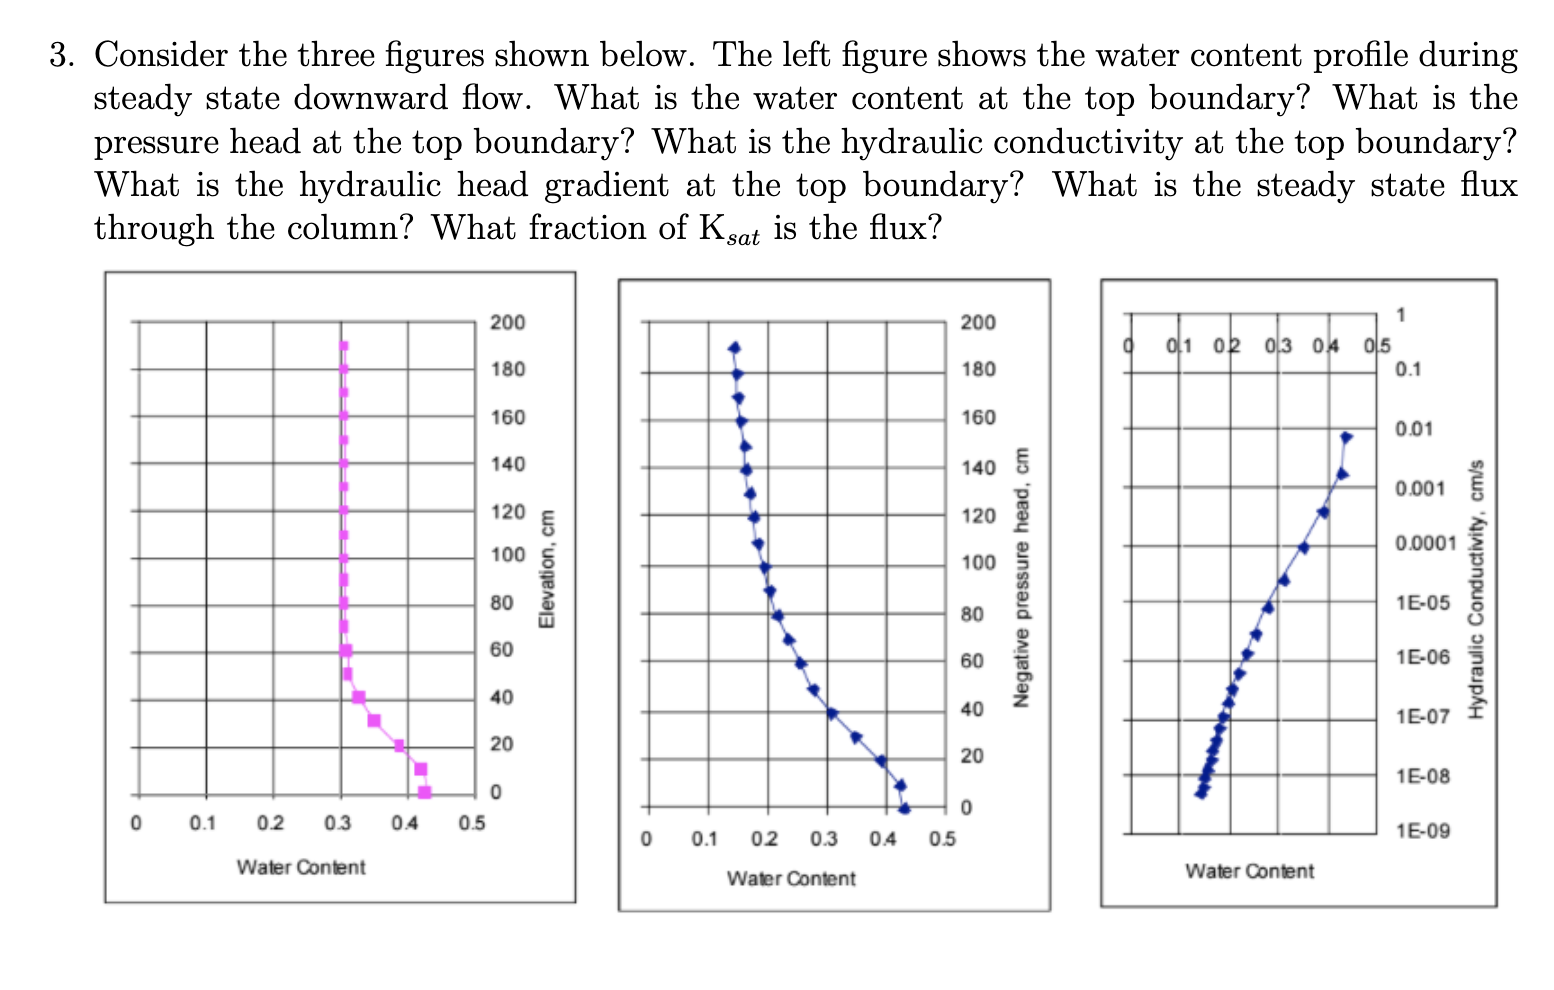
Question: I NEED THE PLOT!!!!!!! PLEASE DO NOT USE AI ! ! ! ! ! ! ! 3 . Consider the three figures shown below. The
I NEED THE PLOT!!!!!!! PLEASE DO NOT USE AI Consider the three figures shown below. The left figure shows the water content profile during steady state downward flow. What is the water content at the top boundary? What is the pressure head at the top boundary? What is the hydraulic conductivity at the top boundary? What is the hydraulic head gradient at the top boundary? What is the steady state flux through the column? What fraction of mathrmKtext sat is the flux?
Repeat question for the hydraulic conductivity as a function of height above the water table.
Plot the hydraulic conductivity on a logarithmic scale
Step by Step Solution
There are 3 Steps involved in it
1 Expert Approved Answer
Step: 1 Unlock

Question Has Been Solved by an Expert!
Get step-by-step solutions from verified subject matter experts
Step: 2 Unlock
Step: 3 Unlock