

Question: I NEED THE TEST STATISTIC THATS IT!!!! nheducation.com/ext/map/index.html?_con=con&external_browser=0&launchUrl=https%253A%252F%252Fathens.blackboard.com%252Fwebapps%252Fport Assignment Chapter 14 Saved Check my work mode : This shows what is correct or incorrect for
I NEED THE TEST STATISTIC THATS IT!!!!
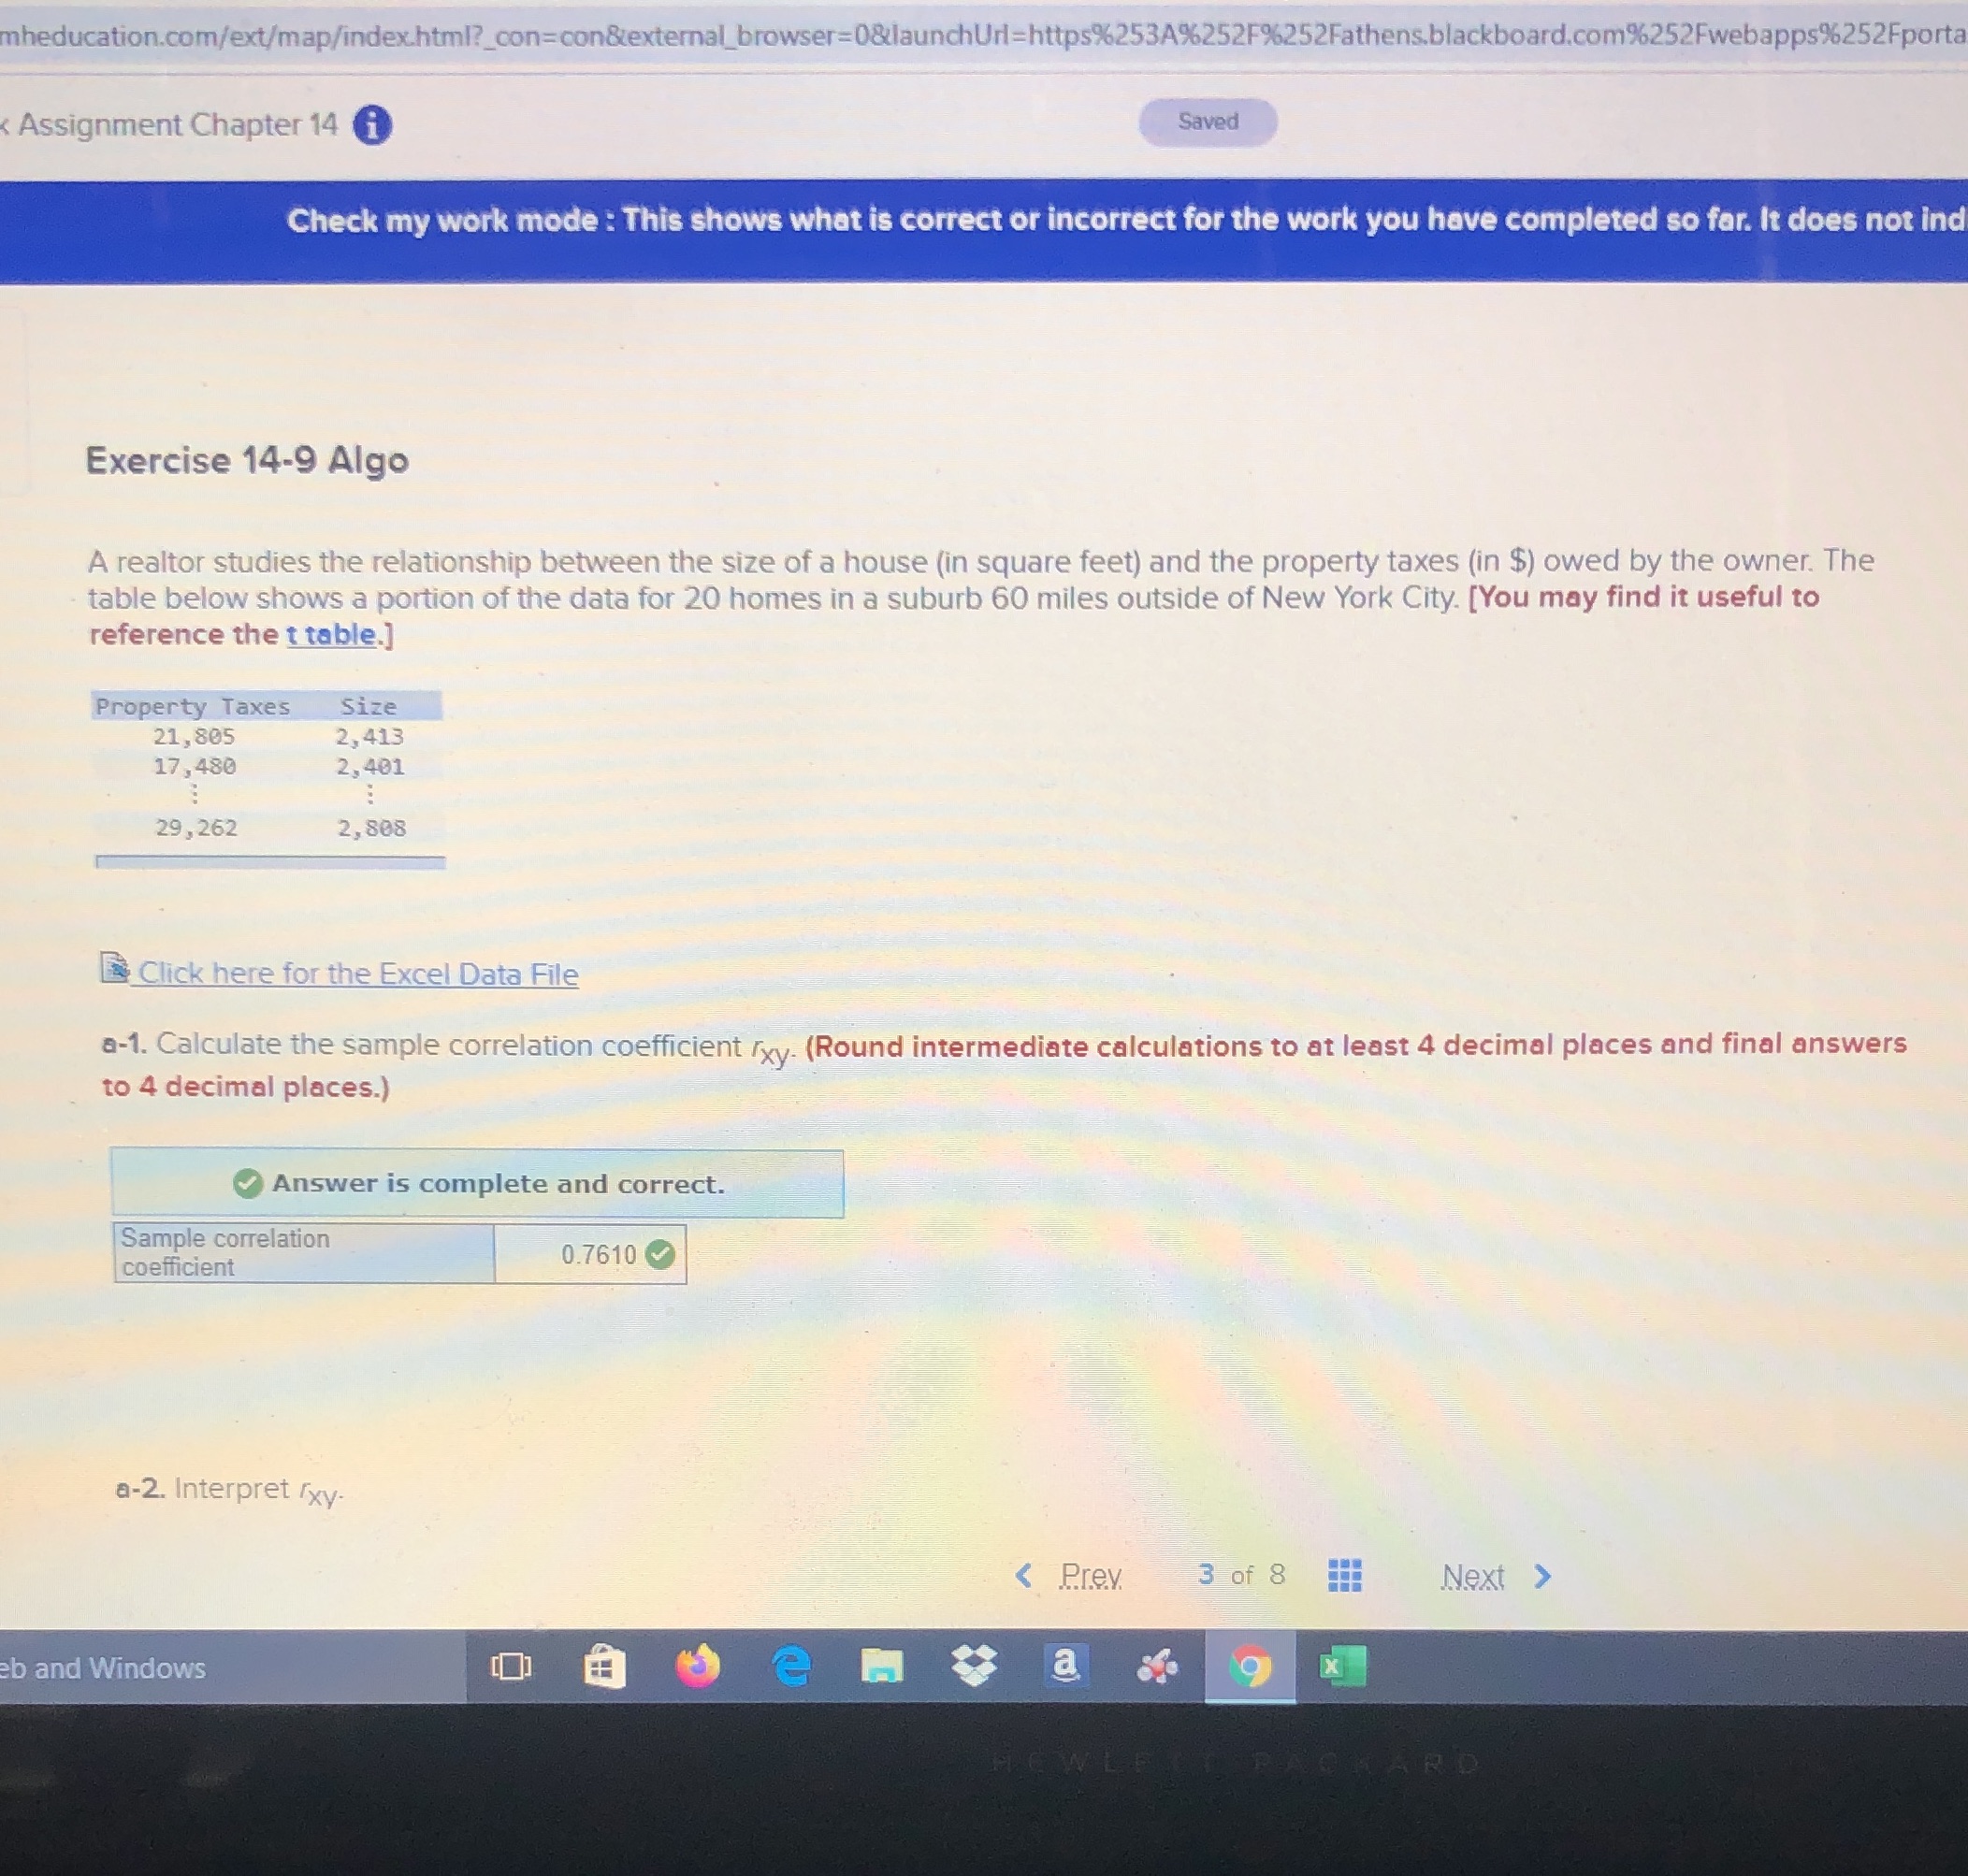
nheducation.com/ext/map/index.html?_con=con&external_browser=0&launchUrl=https%253A%252F%252Fathens.blackboard.com%252Fwebapps%252Fport Assignment Chapter 14 Saved Check my work mode : This shows what is correct or incorrect for the work you have completed so far. It does not inc Exercise 14-9 Algo A realtor studies the relationship between the size of a house (in square feet) and the property taxes (in $) owed by the owner. The table below shows a portion of the data for 20 homes in a suburb 60 miles outside of New York City. [You may find it useful to reference the t table.] Property Taxes Size 21, 805 2, 413 17, 480 2, 401 29, 262 2,808 Click here for the Excel Data File a-1. Calculate the sample correlation coefficient xy. (Round intermediate calculations to at least 4 decimal places and final answers to 4 decimal places.) Answer is complete and correct. Sample correlation coefficient 0.7610 a-2. Interpret fxy. eb and Windows a 9 x
Step by Step Solution
There are 3 Steps involved in it

Get step-by-step solutions from verified subject matter experts