

Question: I need these three functions plotted in matlab, what am i doing wrong that im getting only 1 function? b. When you look at your
I need these three functions plotted in matlab, what am i doing wrong that im getting only 1 function?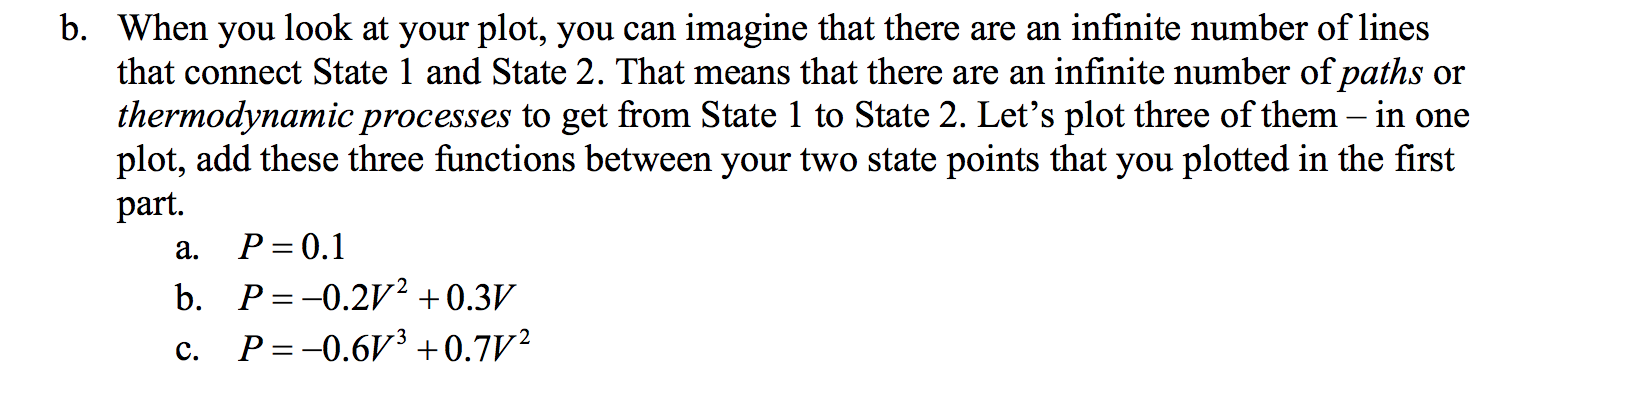
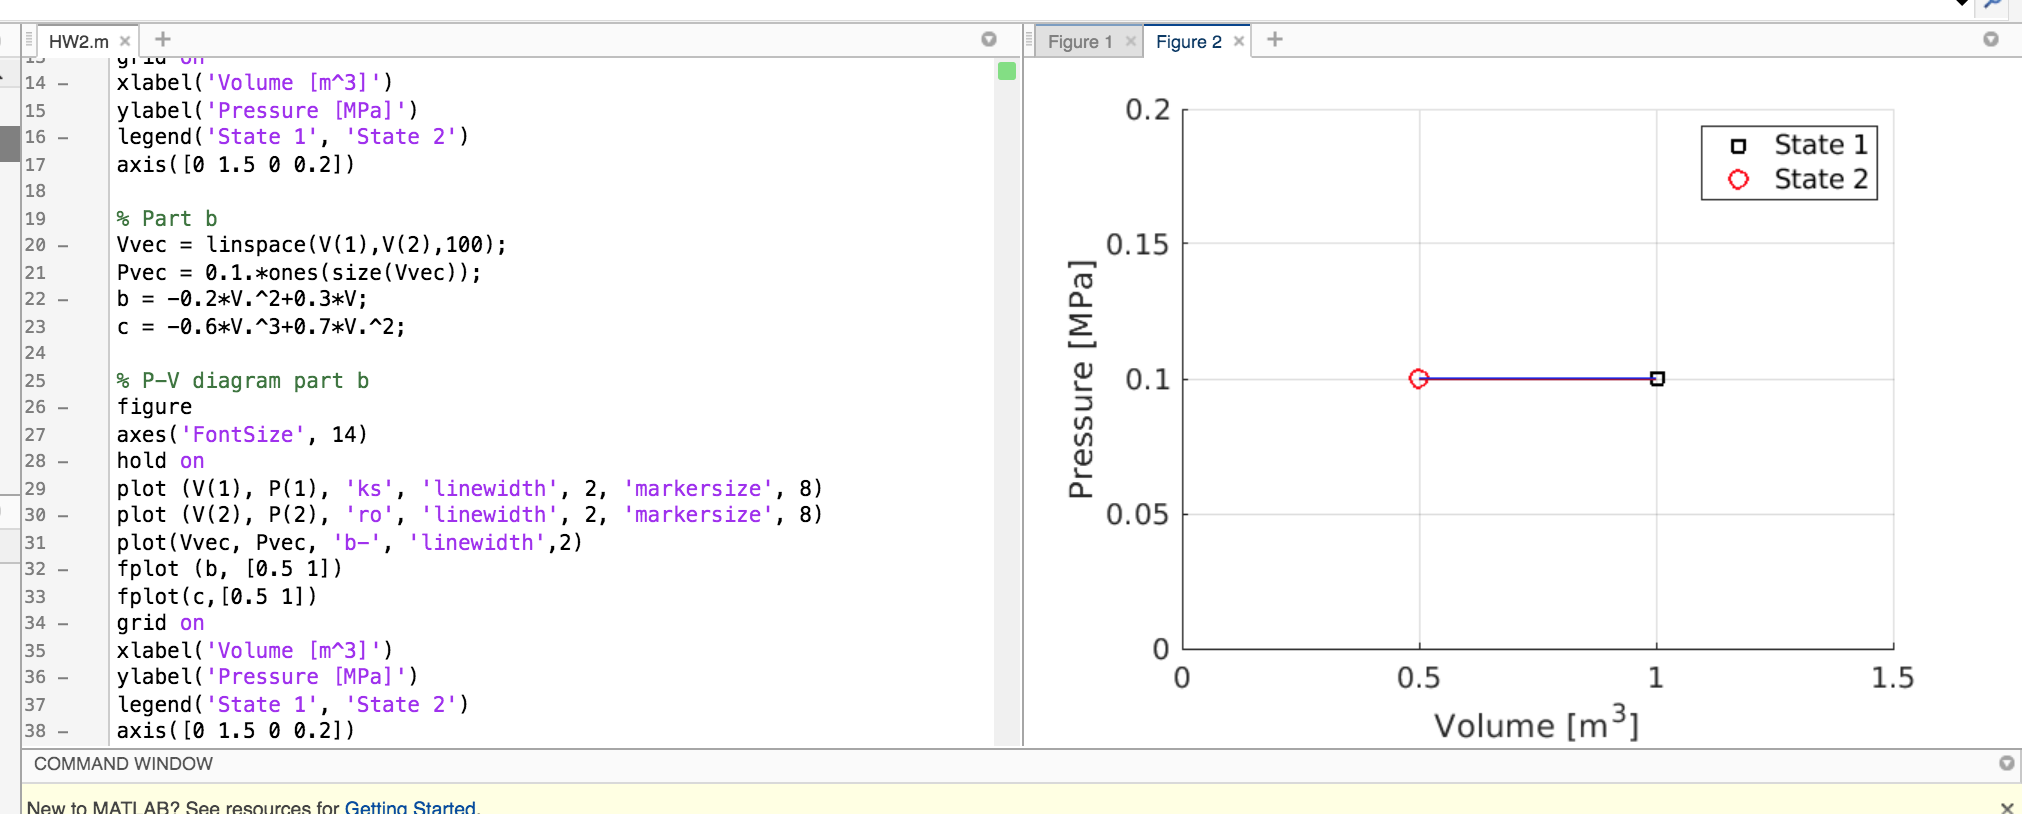
b. When you look at your plot, you can imagine that there are an infinite number of lines that connect State 1 and State 2. That means that there are an infinite number of paths or thermodynamic processes to get from State 1 to State 2. Let's plot three of them in one plot, add these three functions between your two state points that you plotted in the first part. a. P=0.1 b. P=-0.2V2 +0.3V C. P=-0.6V3 +0.7V2 Figure 1 x Figure 2 x HW2. mx + yi tu Un xlabel('Volume [m^3]') ylabel( 'Pressure [MPa]') legend('State 1', 'State 2'). axis ( [0 1.5 0 0.2]) o State 1 O State 2 0.15 % Part b Vvec = linspace(V(1), (2), 100); Pvec = 0.1.*ones (size(Vvec)); b = -0.2*V.^2+0.3*V; C = -0.6*V.^3+0.7*V.^2; Pressure [MPa] 0.05 % P-V diagram part b figure axes ( 'FontSize', 14) hold on plot (V(1), P(1), 'ks', 'linewidth', 2, 'markersize', 8) plot (V(2), P(2), 'ro', 'linewidth', 2, 'markersize', 8) plot(Vvec, Pvec, 'b-', 'linewidth', 2) fplot (b, [0.5 1]) fplot(c,[0.5 1]) grid on xlabel( 'Volume [m^3]'). ylabel( 'Pressure [MPa]') legend('State 1', 'State 2') 38 - axis ( [0 1.5 0 0.2]). COMMAND WINDOW 0.5 1.5 Volume [m3] New to MATLAB? See resources for Getting Started. ANNOTATIONS TOOLS Figu HW2.m * + % HW2 % Given P = [0.1,0.1); % Pressure [MPa] V = [1,0.5]; % Volume [m3] % P-V diagram figure axes ( 'FontSize', 14) hold on plot (V(1), P(1), 'ks' 'linewidth', 2, 'markersize', 8) plot (V(2), P(2), 'ro', 'linewidth', 2, 'markersize', 8) grid on xlabel('Volume [m^3]') y label('Pressure [MPa]') legend('State l', 'State 2') axis ( [0 1.5 0 0.2]) % Part b Vvec = linspace(V(1), (2), 100); Pvec = 0.1.*ones (size (vec)); b = -0.2*V.^2+0.3*V; C = -0.6*V.^3+0.7*V.^2; % P-V diagram part b COMMAND WINDOW New to MATLAB? See resources for Getting Started
Step by Step Solution
There are 3 Steps involved in it

Get step-by-step solutions from verified subject matter experts