

Question: I need this Answer at half time Here are my readings of the lab attached below :- Distance (D) (cm) HEIGHT (cm) Uncertainty In Height(cm)
I need this Answer at half time
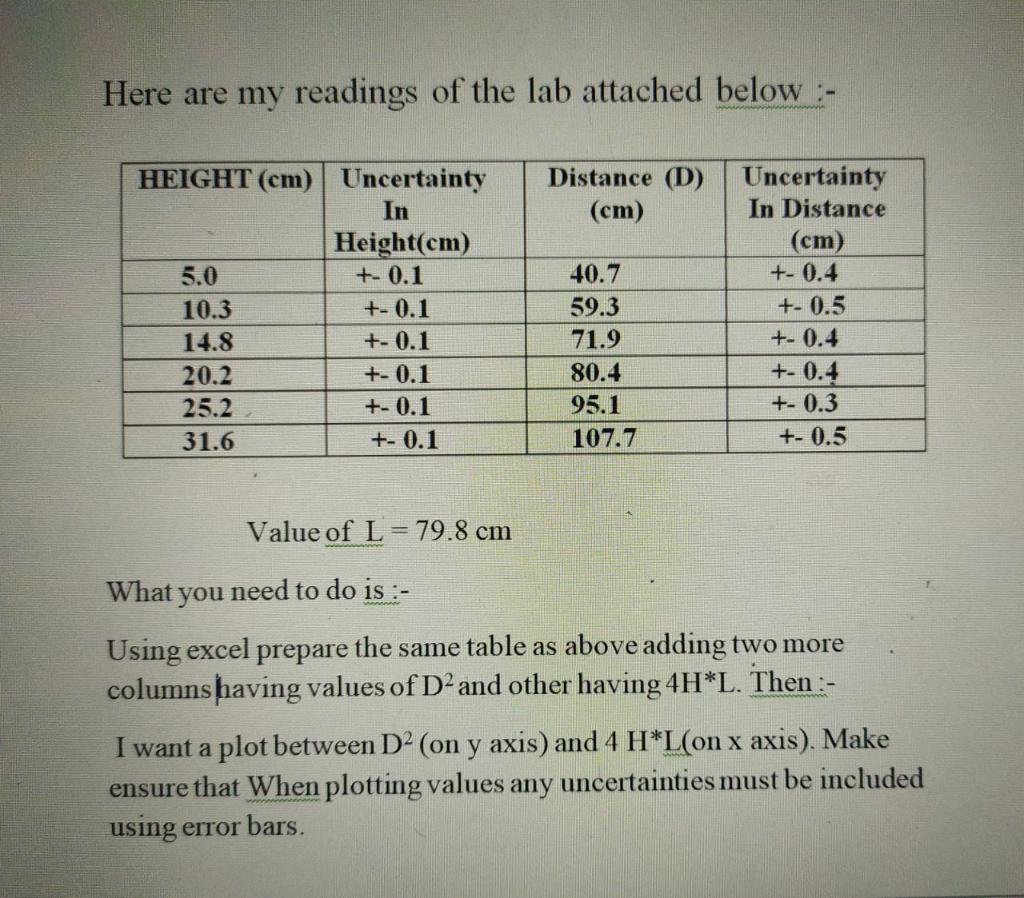
Here are my readings of the lab attached below :- Distance (D) (cm) HEIGHT (cm) Uncertainty In Height(cm) 5.0 +- 0.1 10.3 +-0.1 14.8 +-0.1 20.2 +-0.1 25.2 +- 0.1 31.6 +- 0.1 40.7 59.3 71.9 80.4 95.1 107.7 Uncertainty In Distance (cm) +- 0.4 +-0.5 +-0.4 +-0.4 +-0.3 +-0.5 Value of L = 79.8 cm What you need to do is :- Using excel prepare the same table as above adding two more columnshaving values of D and other having 4H*L. Then :- I want a plot between DP (on y axis) and 4 H*L(on x axis). Make ensure that When plotting values any uncertainties must be included using error bars
Step by Step Solution
There are 3 Steps involved in it
1 Expert Approved Answer
Step: 1 Unlock

Question Has Been Solved by an Expert!
Get step-by-step solutions from verified subject matter experts
Step: 2 Unlock
Step: 3 Unlock