

Question: I need to compare the three histograms. The first two are sample means (n=5, n=10) and the last one is the population. I need to


I need to compare the three histograms. The first two are sample means (n=5, n=10) and the last one is the population. I need to describe the similarities and differences.
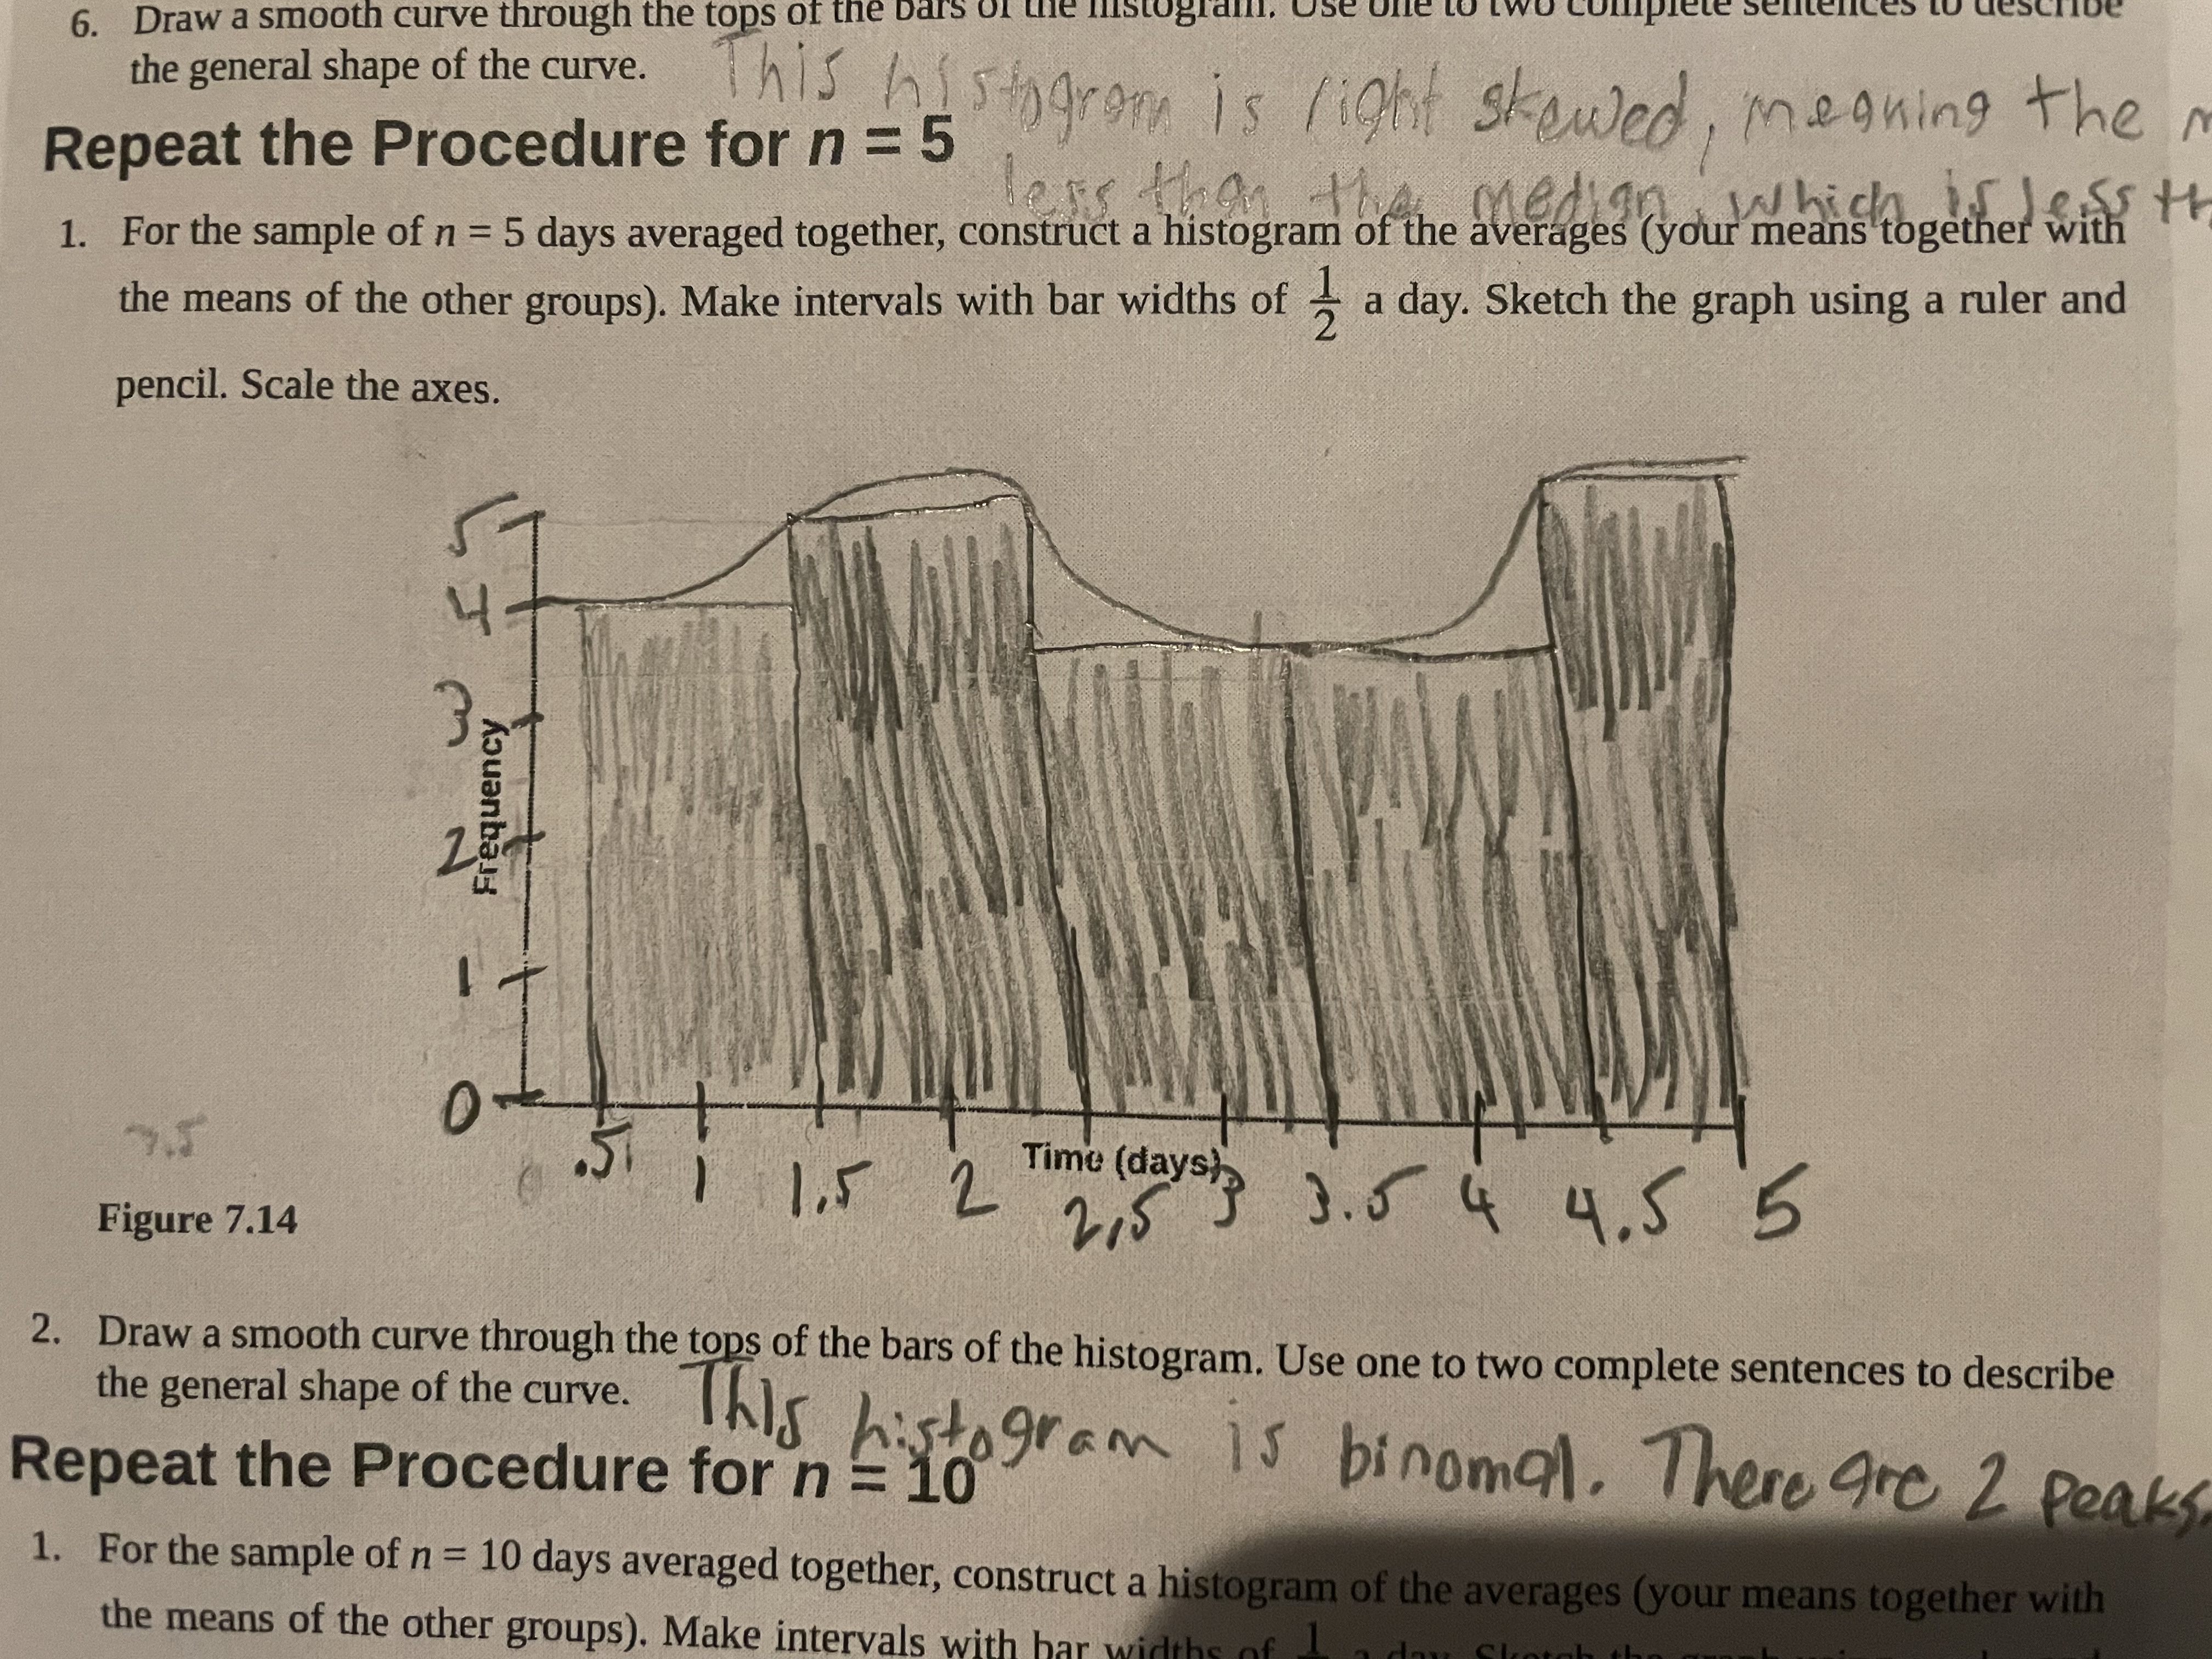
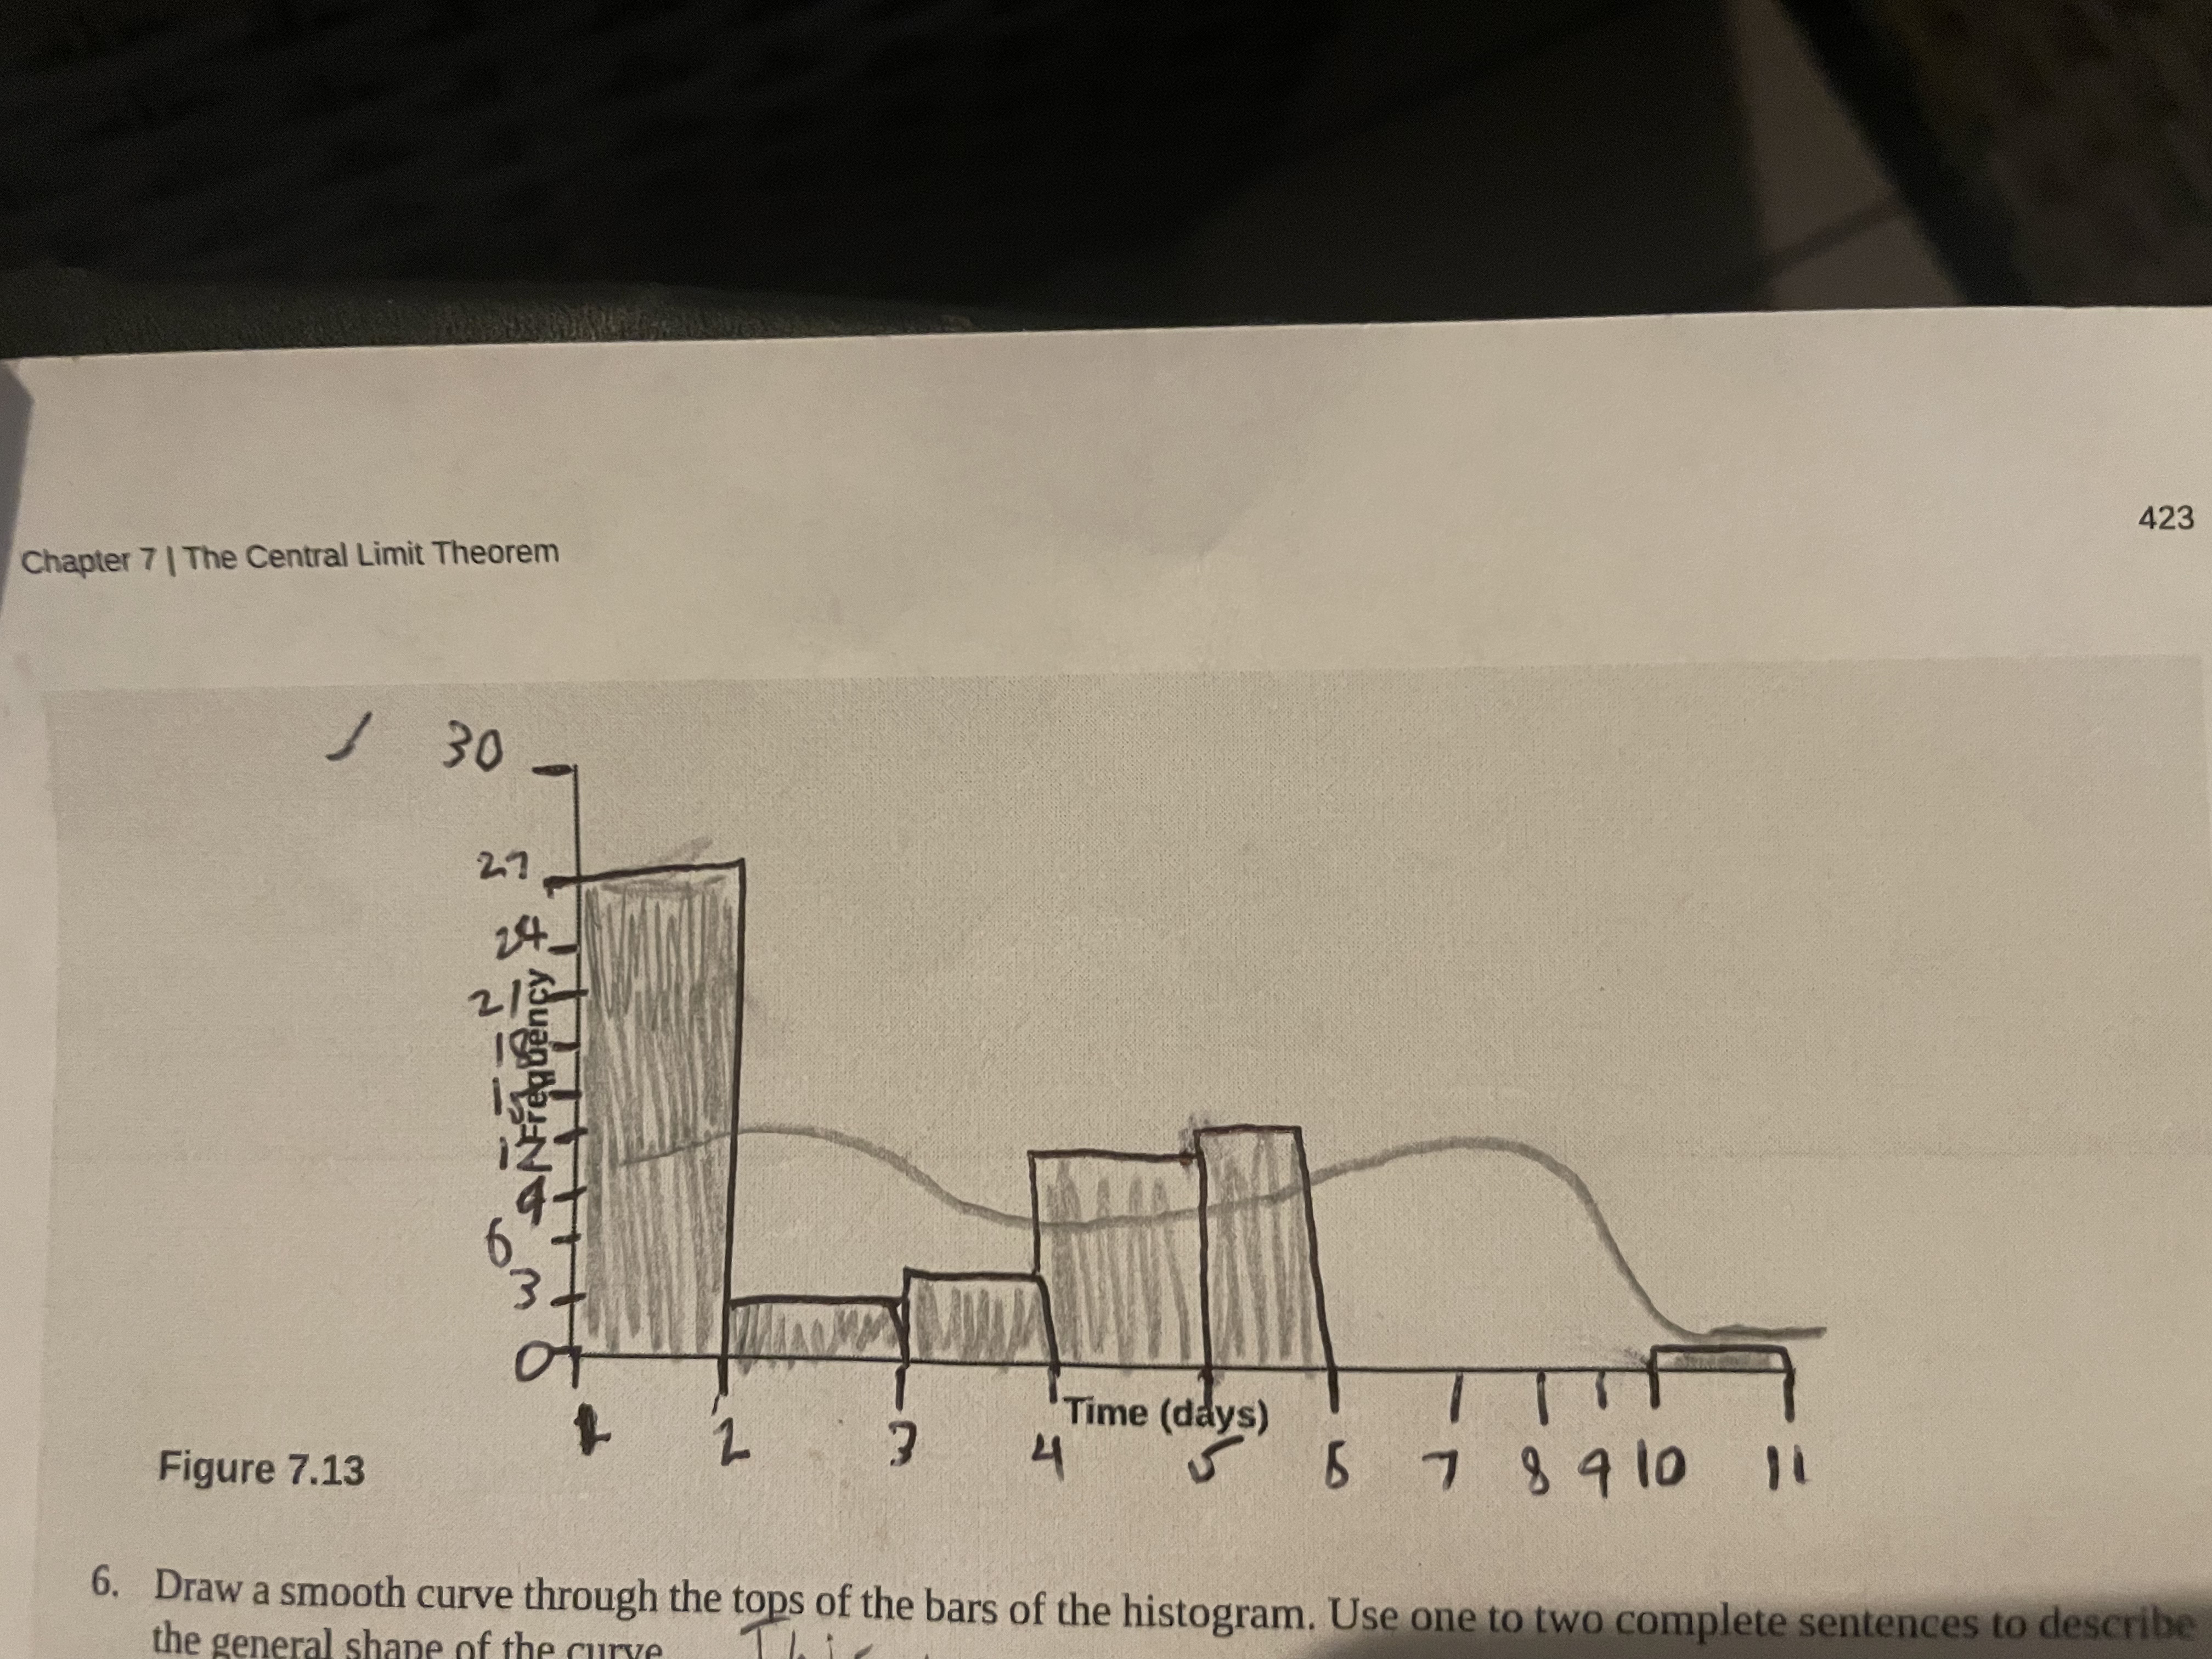
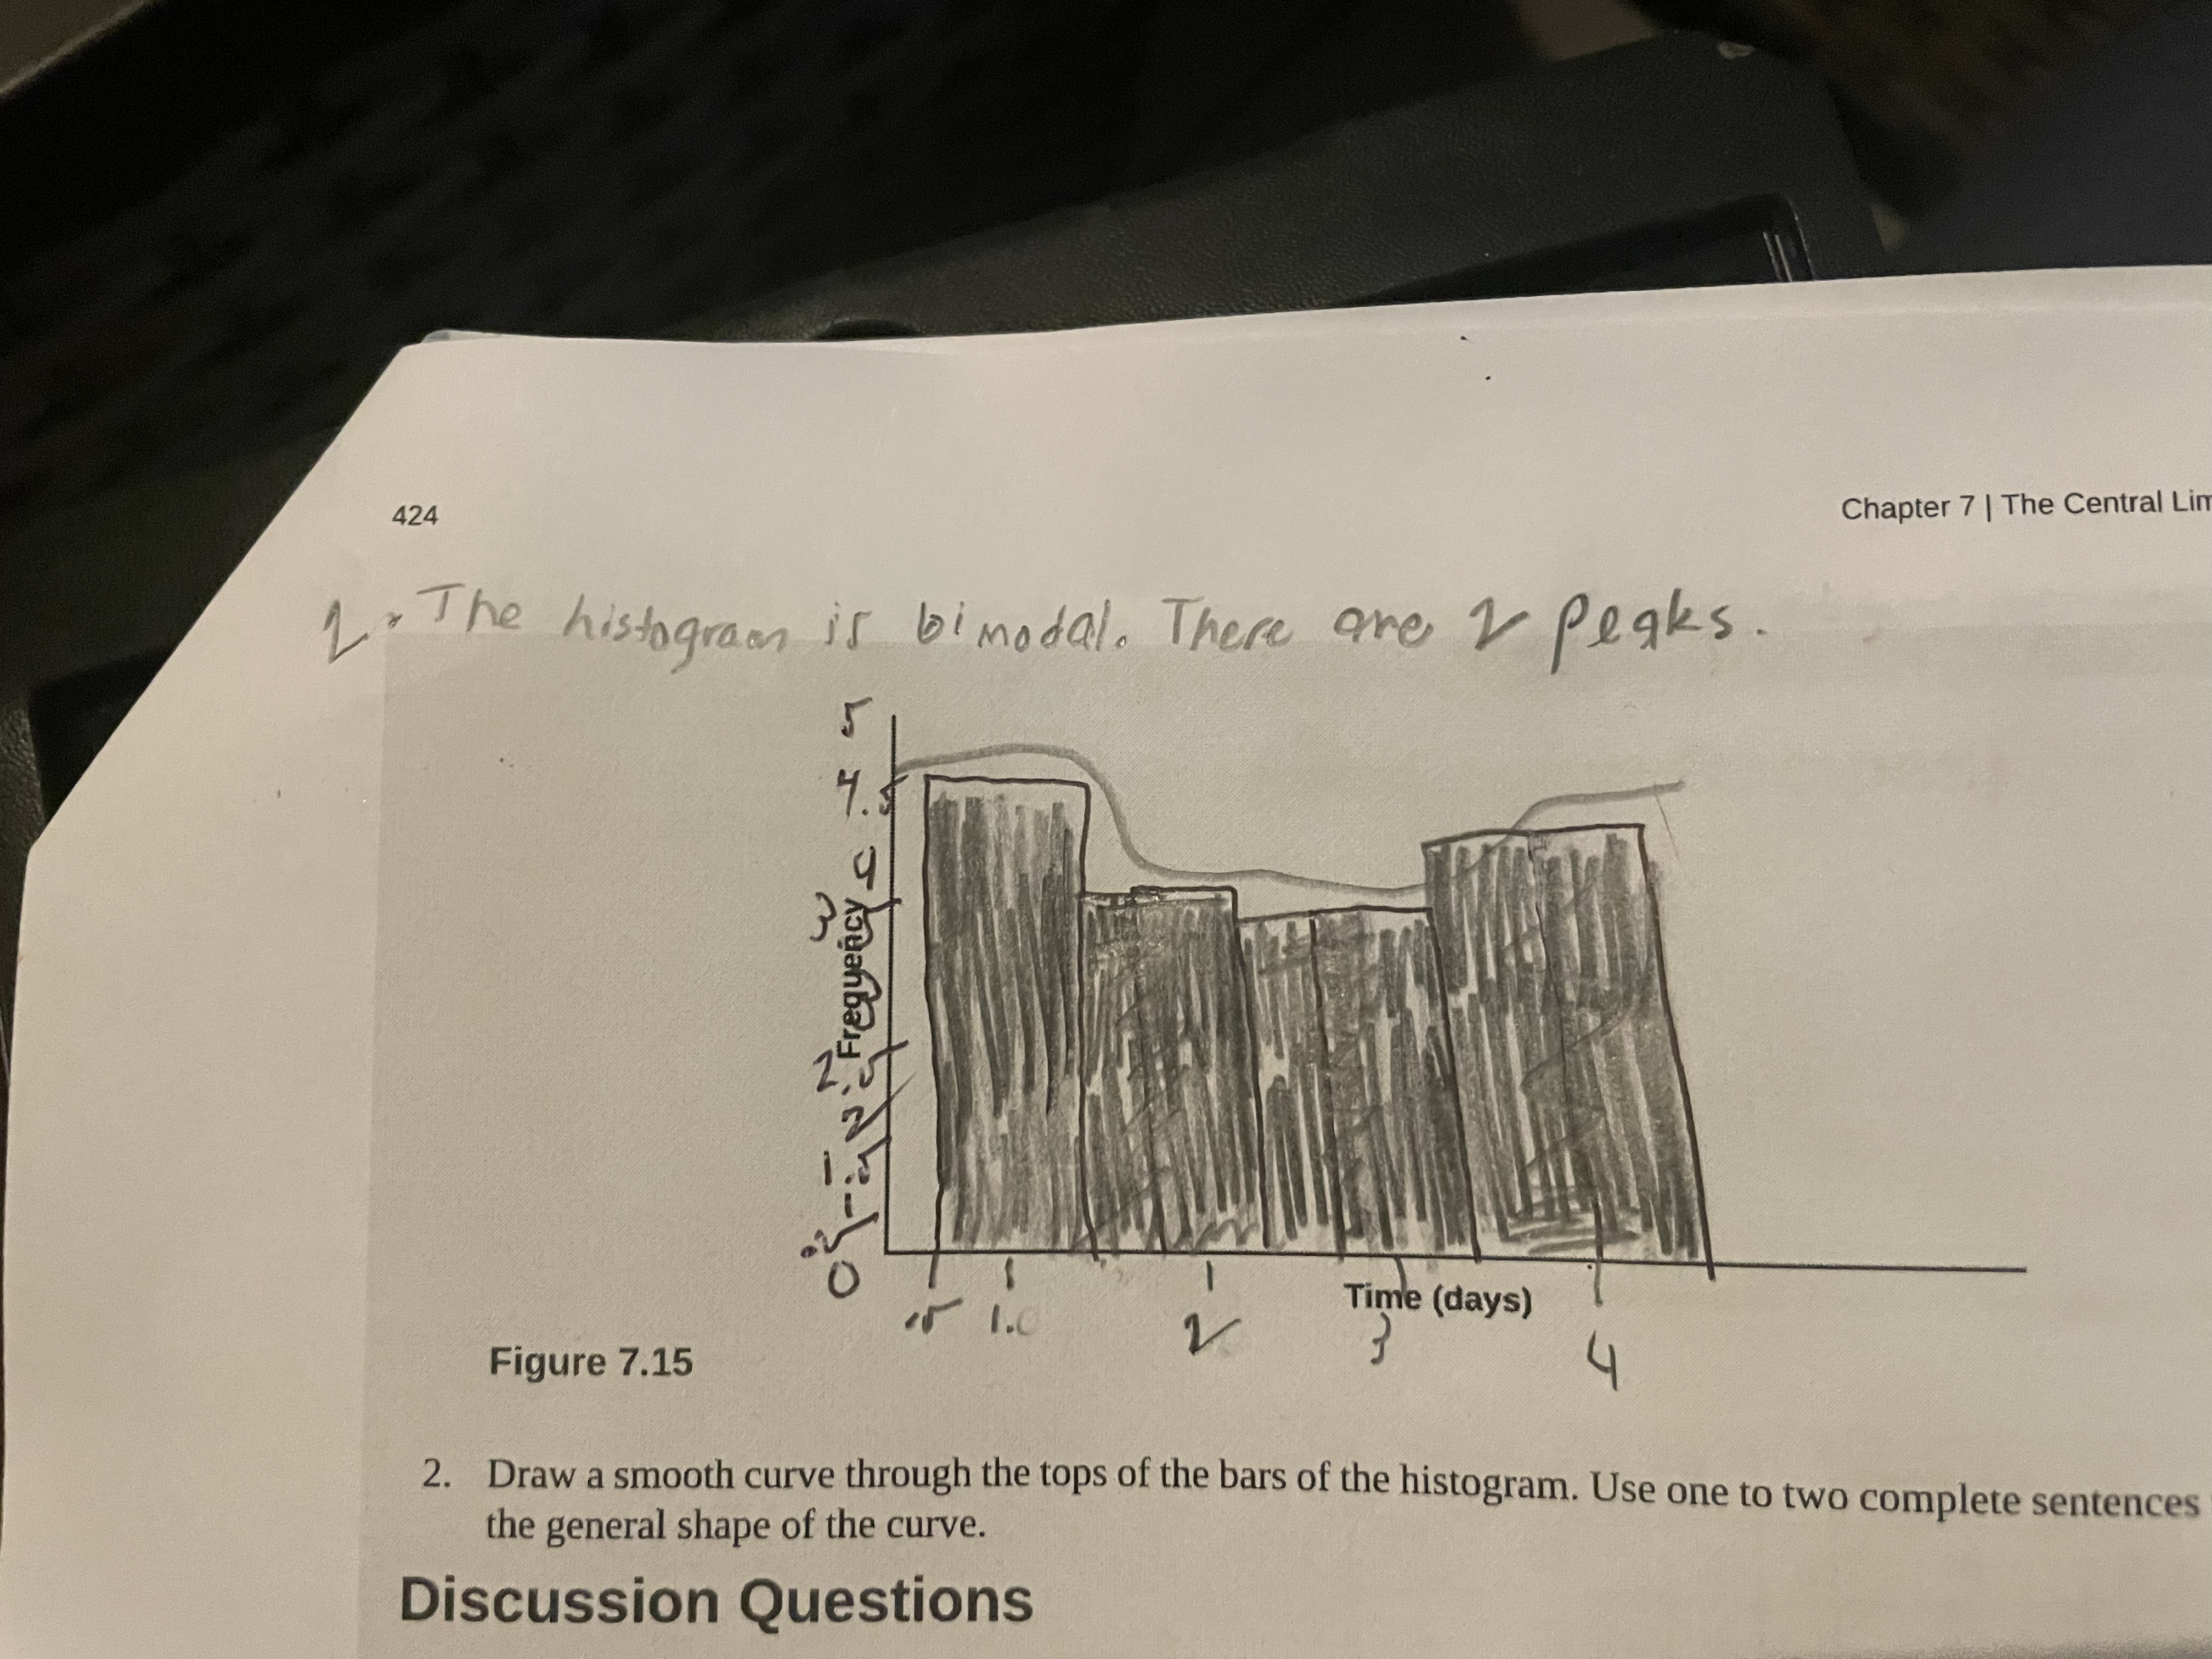
6. Draw a smooth e through the tops the general shape of the curve. Repeat the Procedure for n = 5 This histogram is right skewed, meaning the less than the median which IsIs 1. For the sample of n = 5 days averaged together, construct a histogram of the averages (your means together with the means of the other groups). Make intervals with bar widths of - a day. Sketch the graph using a ruler and pencil. Scale the axes. Frequency Figure 7.14 1 1.5 2 Tim 215 3 3.5 4 4.5 5 2. Draw a smooth curve through the tops of the bars of the histogram. Use one to two complete sentences to describe the general shape of the curve. This histogram is binomal. There are 2 peaks Repeat the Procedure for n = 10 1. For the sample of n = 10 days averaged together, construct a histogram of the averages (your means together with the means of the other groups). Make intervals with bar423 Chapter 7 | The Central Limit Theorem Time (days) J Figure 7.13 5 7 8 9 10 11 6. Draw a smooth curve through the tops of the bars of the histogram. Use one to two complete sentences to describe the general shape424 Chapter 7 | The Central Li 1. The histogram is bimodal. There are I Peaks. - d Time (days) Figure 7.15 J 2. Draw a smooth curve through the tops of the bars of the histogram. Use one to two complete sentences the general shape of the curve. Discussion Questions
Step by Step Solution
There are 3 Steps involved in it

Get step-by-step solutions from verified subject matter experts