

Question: i need to create a example about Trigonometry (similarto the picture shown) plz helpp Exponentials When a golf ball bounces it doesn't return to it's
i need to create a example about Trigonometry (similarto the picture shown) plz helpp
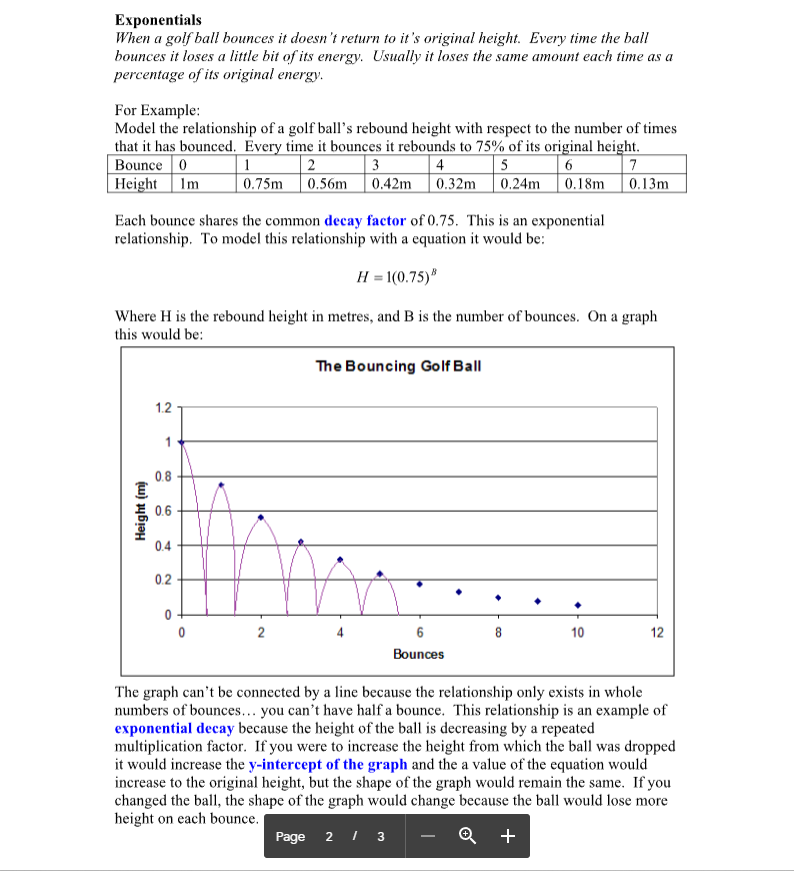
Exponentials When a golf ball bounces it doesn't return to it's original height. Every time the ball bounces it loses a little bit of its energy. Usually it loses the same amount each time as a percentage of its original energy. For Example: Model the relationship of a golf ball's rebound height with respect to the number of times that it has bounced. Every time it bounces it rebounds to 75% of its original height. Bounce 0 2 3 4 5 6 7 Height Im 0.75m 0.56m 0.42m 0.32m 0.24m 0.18m 0.13m Each bounce shares the common decay factor of 0.75. This is an exponential relationship. To model this relationship with a equation it would be; H = 1(0.75)# Where H is the rebound height in metres, and B is the number of bounces. On a graph this would be: The Bouncing Golf Ball 1.2 0.8 Height (m) 0.6 0.4 0.2 8 10 12 Bounces The graph can't be connected by a line because the relationship only exists in whole numbers of bounces... you can't have half a bounce. This relationship is an example of exponential decay because the height of the ball is decreasing by a repeated multiplication factor. If you were to increase the height from which the ball was dropped it would increase the y-intercept of the graph and the a value of the equation would increase to the original height, but the shape of the graph would remain the same. If you changed the ball, the shape of the graph would change because the ball would lose more height on each bounce. Page 2 1 3 +
Step by Step Solution
There are 3 Steps involved in it

Get step-by-step solutions from verified subject matter experts