

Question: I need to create a Matlab program that does the following I believe the display should be output in an fpintf format here are some
I need to create a Matlab program that does the following
I believe the display should be output in an fpintf format here are some hints for command to use

and at the end the program is supposed to display something like this
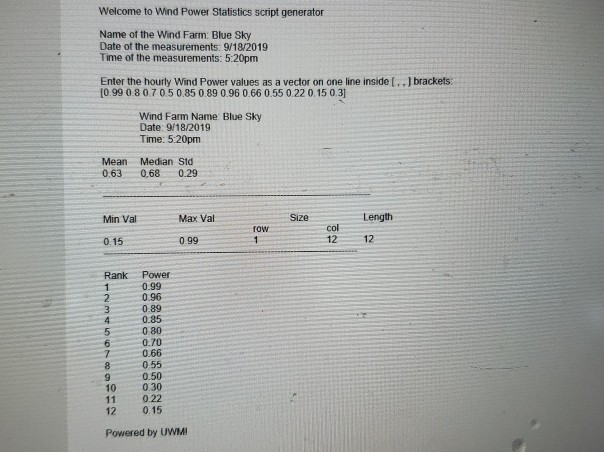
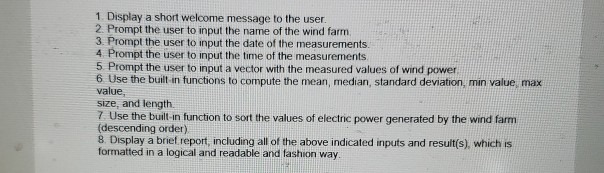
1. Display a short welcome message to the user. 2. Prompt the user to input the name of the wind farm 3. Prompt the user to input the date of the measurements. 4 Prompt the user to input the time of the measurements 5. Prompt the user to input a vector with the measured values of wind power 6. Use the built in functions to compute the mean, median, standard deviation, min value, max value, size, and length 7. Use the built-in function to sort the values of electric power generated by the wind farm (descending order) 8. Display a brief report, including all of the above indicated inputs and result(s) which is formatted in a logical and readable and fashion way Your program should produce an identical output (when given the same input(s)) to the sample run(s) below, values and format. Some of the following function may help you with your script - input . fprintf mean . median std max min sort size (size of the hourly Wind power vector) length (length of the hourly Wind power vector) Welcome to Wind Power Statistics script generator Name of the Wind Farm: Blue Sky Date of the measurements: 9/18/2019 Time of the measurements: 5:20pm Enter the hourly Wind Power values as a vector on one line inside (. , brackets: [0.99 0.8 0.7 0.5 0.85 0.89 0.96 0.66 0.55 0.22 0.15 0.31 Wind Farm Name Blue Sky Date: 9/18/2019 Time: 5:20pm Mean Median Std 0.63 0.68 0.29 Min Val Max Val Size Length TOW col 12 0.15 0.99 12 Rank LOND Power 0.99 0.96 0.89 0.95 0 80 0.70 0.66 0.55 0.50 0 30 0.22 0 15 Powered by UWM
Step by Step Solution
There are 3 Steps involved in it

Get step-by-step solutions from verified subject matter experts