

Question: I need to do this assignment in excel so I can please see the steps as well as the solution? Thank you. Question 2: For
I need to do this assignment in excel so I can please see the steps as well as the solution? Thank you.
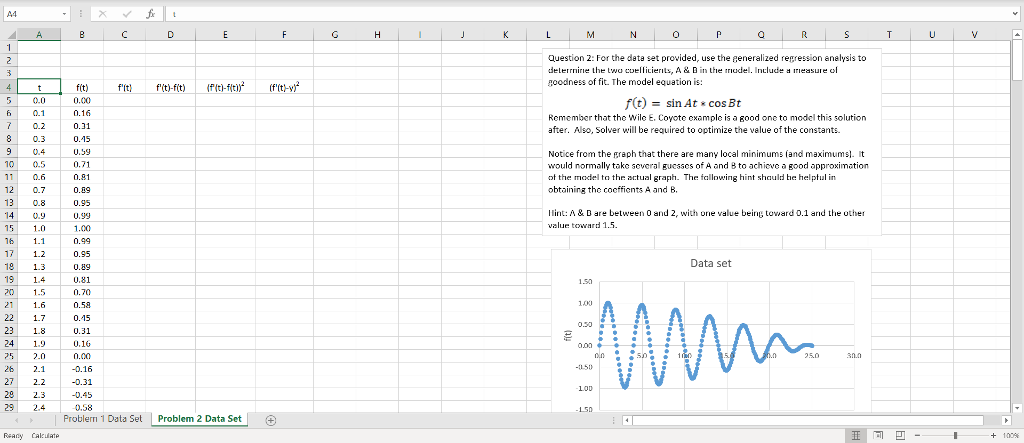
Question 2: For the data set provided, use the generalized regression analysis to determine the two coefficients, A & B in the model. Include a measure of goodness of fit. The model equation is:
Remember that the Wile E. Coyote example is a good one to model this solution after. Also, Solver will be required to optimize the value of the constants.
Notice from the graph that there are many local minimums (and maximums). It would normally take several guesses of A and B to achieve a good approximation of the model to the actual graph. The following hint should be helpful in obtaining the coeffients A and B.
Hint: A & B are between 0 and 2, with one value being toward 0.1 and the other value toward 1.5.
| t | f(t) | f'(t) | f'(t)-f(t) | (f'(t)-f(t))2 | (f'(t)-)2 |
| 0.0 | 0.00 | ||||
| 0.1 | 0.16 | ||||
| 0.2 | 0.31 | ||||
| 0.3 | 0.45 | ||||
| 0.4 | 0.59 | ||||
| 0.5 | 0.71 | ||||
| 0.6 | 0.81 | ||||
| 0.7 | 0.89 | ||||
| 0.8 | 0.95 | ||||
| 0.9 | 0.99 | ||||
| 1.0 | 1.00 | ||||
| 1.1 | 0.99 | ||||
| 1.2 | 0.95 | ||||
| 1.3 | 0.89 | ||||
| 1.4 | 0.81 | ||||
| 1.5 | 0.70 | ||||
| 1.6 | 0.58 | ||||
| 1.7 | 0.45 | ||||
| 1.8 | 0.31 | ||||
| 1.9 | 0.16 | ||||
| 2.0 | 0.00 | ||||
| 2.1 | -0.16 | ||||
| 2.2 | -0.31 | ||||
| 2.3 | -0.45 | ||||
| 2.4 | -0.58 | ||||
| 2.5 | -0.70 | ||||
| 2.6 | -0.80 | ||||
| 2.7 | -0.88 | ||||
| 2.8 | -0.94 | ||||
| 2.9 | -0.97 | ||||
| 3.0 | -0.98 | ||||
| 3.1 | -0.97 | ||||
| 3.2 | -0.93 | ||||
| 3.3 | -0.87 | ||||
| 3.4 | -0.79 | ||||
| 3.5 | -0.69 | ||||
| 3.6 | -0.57 | ||||
| 3.7 | -0.44 | ||||
| 3.8 | -0.30 | ||||
| 3.9 | -0.15 | ||||
| 4.0 | 0.00 | ||||
| 4.1 | 0.15 | ||||
| 4.2 | 0.30 | ||||
| 4.3 | 0.44 | ||||
| 4.4 | 0.57 | ||||
| 4.5 | 0.68 | ||||
| 4.6 | 0.78 | ||||
| 4.7 | 0.85 | ||||
| 4.8 | 0.91 | ||||
| 4.9 | 0.94 | ||||
| 5.0 | 0.95 | ||||
| 5.1 | 0.94 | ||||
| 5.2 | 0.90 | ||||
| 5.3 | 0.84 | ||||
| 5.4 | 0.76 | ||||
| 5.5 | 0.67 | ||||
| 5.6 | 0.55 | ||||
| 5.7 | 0.43 | ||||
| 5.8 | 0.29 | ||||
| 5.9 | 0.15 | ||||
| 6.0 | 0.00 | ||||
| 6.1 | -0.15 | ||||
| 6.2 | -0.29 | ||||
| 6.3 | -0.42 | ||||
| 6.4 | -0.54 | ||||
| 6.5 | -0.65 | ||||
| 6.6 | -0.74 | ||||
| 6.7 | -0.81 | ||||
| 6.8 | -0.87 | ||||
| 6.9 | -0.90 | ||||
| 7.0 | -0.90 | ||||
| 7.1 | -0.89 | ||||
| 7.2 | -0.86 | ||||
| 7.3 | -0.80 | ||||
| 7.4 | -0.72 | ||||
| 7.5 | -0.63 | ||||
| 7.6 | -0.52 | ||||
| 7.7 | -0.40 | ||||
| 7.8 | -0.27 | ||||
| 7.9 | -0.14 | ||||
| 8.0 | 0.00 | ||||
| 8.1 | 0.14 | ||||
| 8.2 | 0.27 | ||||
| 8.3 | 0.39 | ||||
| 8.4 | 0.51 | ||||
| 8.5 | 0.61 | ||||
| 8.6 | 0.69 | ||||
| 8.7 | 0.76 | ||||
| 8.8 | 0.81 | ||||
| 8.9 | 0.84 | ||||
| 9.0 | 0.84 | ||||
| 9.1 | 0.83 | ||||
| 9.2 | 0.80 | ||||
| 9.3 | 0.74 | ||||
| 9.4 | 0.67 | ||||
| 9.5 | 0.58 | ||||
| 9.6 | 0.48 | ||||
| 9.7 | 0.37 | ||||
| 9.8 | 0.25 | ||||
| 9.9 | 0.13 | ||||
| 10.0 | 0.00 | ||||
0 Question 2: For the data set provided, use the generalized regression anelysis to deler mine the two coellicients, A & B in the mudel. Includ 'measure ol goodness of fit. The model equation is: fit) 0.00 0.16 0.31 0.15 fit)-fit) 5 0.0 f(t) sin At cos Bt Remember that the Wile E. Coyote example is a good one to model this solution after. Also, Solver wl be required to optimize the value of the constants. 70.2 8 0.3 9 4 10 0.5 11 0.6 12 07 13 0.8 14 0.9 15 10 16 1.1 17 1.2 1 13 19 1.4 20 1.5 21 1.6 22 1.7 23 18 24 1.9 25 2.0 26 2.1 27 2.2 29 2.3 23 2.4 Notice from the praph that there are many local minimums (and maximumsl. It would nomally take several guesses of A and B to achicve a good approximation ot the madel ta thr actual graph. The fallowing hint shauld he helptul in obtaining the coofficnts A and B. 0.71 0.09 0.95 Hint:A & D are between 0 and 2, with one vale bei value toward 1.5. toward 0.1 and the other 1.00 0.99 0.95 0.89 0,81 0.70 0.58 Data set 1.50 0.30 0.31 0,16 0.16 0.31 0.45 0.58 Problerm 1 Data Set Problem 2 Data Set Ready Cakuate +100% 0 Question 2: For the data set provided, use the generalized regression anelysis to deler mine the two coellicients, A & B in the mudel. Includ 'measure ol goodness of fit. The model equation is: fit) 0.00 0.16 0.31 0.15 fit)-fit) 5 0.0 f(t) sin At cos Bt Remember that the Wile E. Coyote example is a good one to model this solution after. Also, Solver wl be required to optimize the value of the constants. 70.2 8 0.3 9 4 10 0.5 11 0.6 12 07 13 0.8 14 0.9 15 10 16 1.1 17 1.2 1 13 19 1.4 20 1.5 21 1.6 22 1.7 23 18 24 1.9 25 2.0 26 2.1 27 2.2 29 2.3 23 2.4 Notice from the praph that there are many local minimums (and maximumsl. It would nomally take several guesses of A and B to achicve a good approximation ot the madel ta thr actual graph. The fallowing hint shauld he helptul in obtaining the coofficnts A and B. 0.71 0.09 0.95 Hint:A & D are between 0 and 2, with one vale bei value toward 1.5. toward 0.1 and the other 1.00 0.99 0.95 0.89 0,81 0.70 0.58 Data set 1.50 0.30 0.31 0,16 0.16 0.31 0.45 0.58 Problerm 1 Data Set Problem 2 Data Set Ready Cakuate +100%
Step by Step Solution
There are 3 Steps involved in it

Get step-by-step solutions from verified subject matter experts