

Question: I need to fix the R code for my graph so I can group the years in either 5 or 10-year increments. Code: install.packages(tidyverse) install.packages(tidydr)
I need to fix the R code for my graph so I can group the years in either 5 or 10-year increments.
Code:
install.packages("tidyverse") install.packages("tidydr") library(tidydr) library(tidyverse) ggplot(data=trend4) + geom_point(mapping = aes(x = reorder(church4, year), y = gini_net, color = country)) + xlab("Religiousity") + ylab("Country GDP")
This is what it looks like:
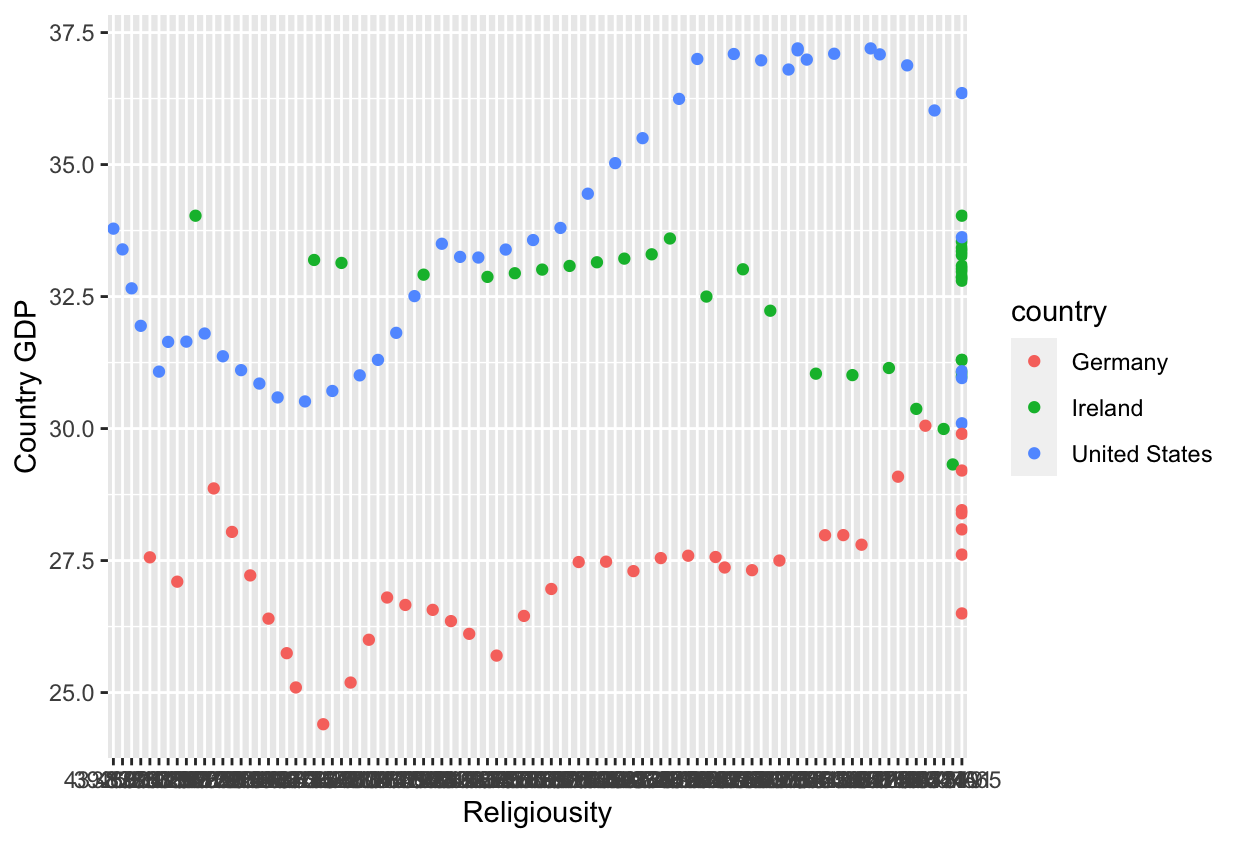
37.5- 35.0 - 32.5 - country Germany Country GDP 30.0 - Ireland United States 27.5 - 25.0 - Religiousity
Step by Step Solution
There are 3 Steps involved in it
1 Expert Approved Answer
Step: 1 Unlock

Question Has Been Solved by an Expert!
Get step-by-step solutions from verified subject matter experts
Step: 2 Unlock
Step: 3 Unlock