

Question: i need to know how to make a graph like this ASAP with the information below using excel I just need to know how to
i need to know how to make a graph like this ASAP with the information below using excel 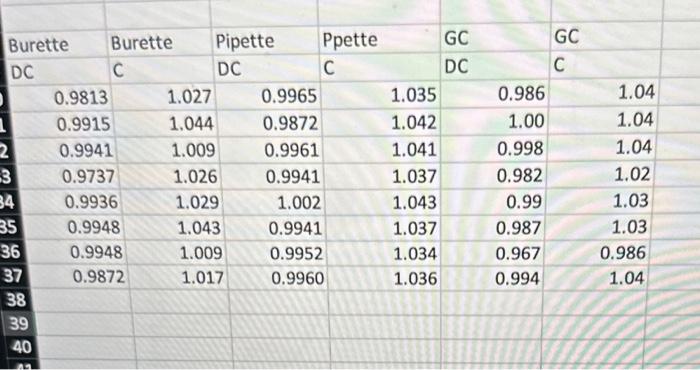
I just need to know how to make this graph: 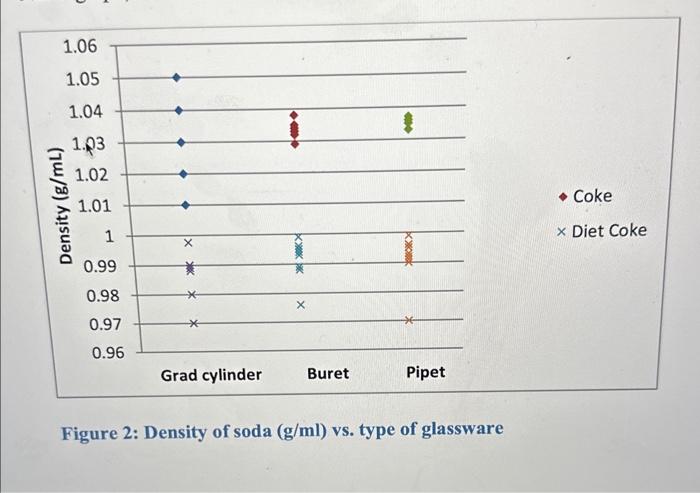
with this information
i just need steps to make graph with Excel!
PLEASE I NEED ASAP I WILL UPVOTE
Figure 2: Density of soda (g/ml) vs. type of glassware
Step by Step Solution
There are 3 Steps involved in it
1 Expert Approved Answer
Step: 1 Unlock

Question Has Been Solved by an Expert!
Get step-by-step solutions from verified subject matter experts
Step: 2 Unlock
Step: 3 Unlock