

Question: I need to make a boxplot and find outliers The following data represent the amount of snowfall (in inches) received at Squaw Valley, CA from
I need to make a boxplot and find outliers
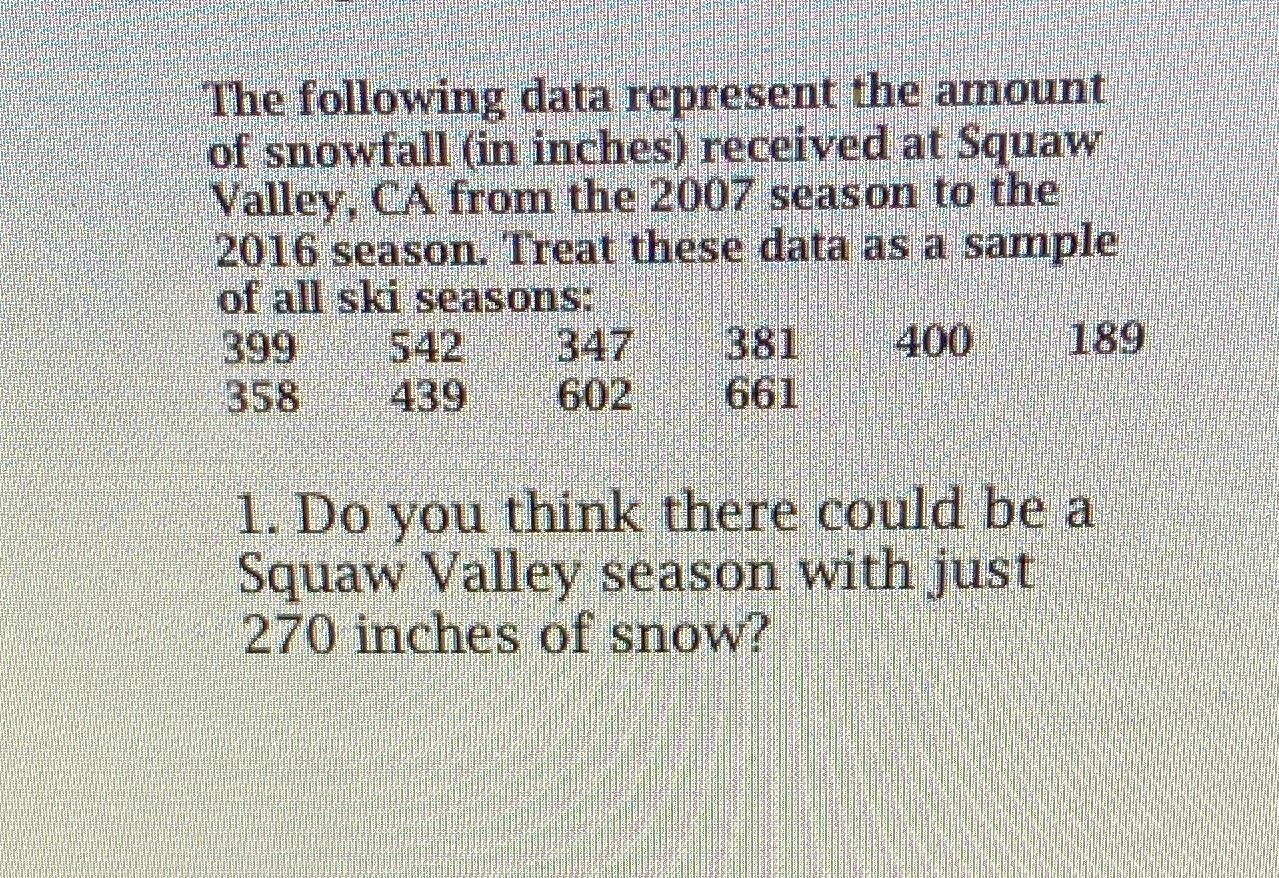
The following data represent the amount of snowfall (in inches) received at Squaw Valley, CA from the 2007 season to the 2016 season. Treat these data as a sample of all ski seasons: 399 542 347 381 400 189 358 439 602 661 1. Do you think there could be a Squaw Valley season with just 270 inches of snow
Step by Step Solution
There are 3 Steps involved in it
1 Expert Approved Answer
Step: 1 Unlock

Question Has Been Solved by an Expert!
Get step-by-step solutions from verified subject matter experts
Step: 2 Unlock
Step: 3 Unlock