

Question: I need to use excel to solve this problem 3.6 Experimentally Determining a Value for TT The circumference and diameter of a circle are related
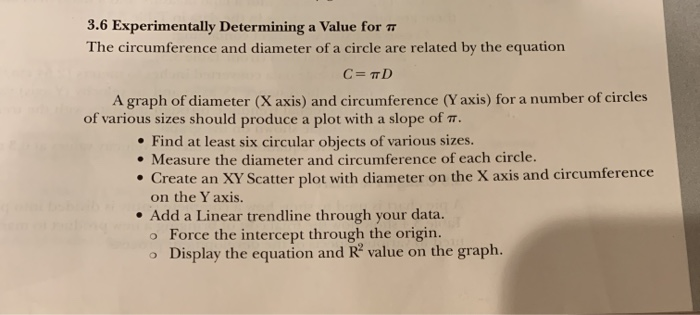
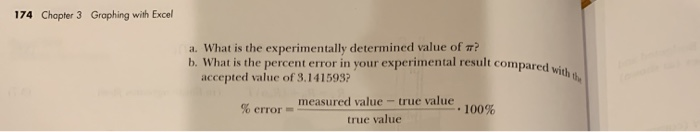
3.6 Experimentally Determining a Value for TT The circumference and diameter of a circle are related by the equation C= D A graph of diameter (X axis) and circumference (Yaxis) for a number of circles of various sizes should produce a plot with a slope of TT. Find at least six circular objects of various sizes. Measure the diameter and circumference of each circle. Create an XY Scatter plot with diameter on the X axis and circumference on the Y axis. Add a Linear trendline through your data. o Force the intercept through the origin. Display the equation and R' value on the graph. 174 Chapter 3 Graphing with Excel pared with the a. What is the experimentally determined value of ? b. What is the percent error in your experimental result compared accepted value of 3.141593? % error measured value - true value . 100% true value
Step by Step Solution
There are 3 Steps involved in it

Get step-by-step solutions from verified subject matter experts