

Question: I NEED TO USE MATLAB FORMAT WITH proper programming standards PLEASE HELP For this problem, we must model the global averages in CO2 and N2O
I NEED TO USE MATLAB FORMAT WITH proper programming standards PLEASE HELP
For this problem, we must model the global averages in CO2 and N2O atmospheric concentrations.
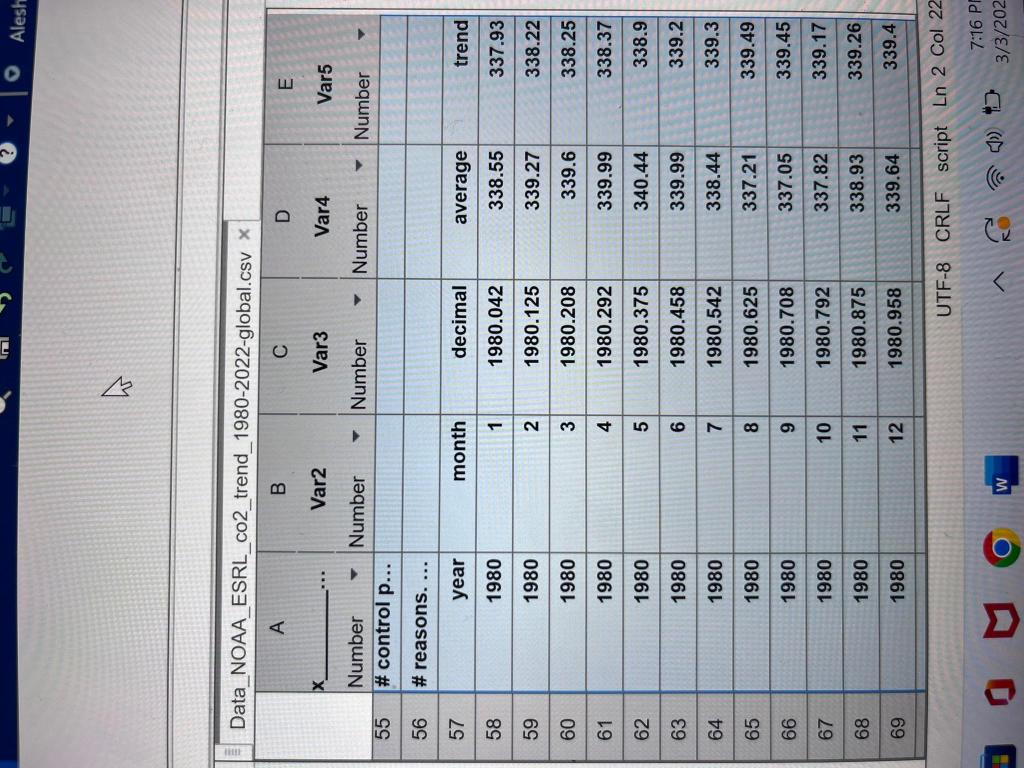
We will find the CO2 data, with its complete NOAA header, in the file named Data_NOAA_ESRL_CO2_trend_1980-2022 global.csv and the N2O data in the file Data_NOAA_ESRL_N2O_trend_2001-2022.txt.
Write a MATLAB no-input, no-output function to perform least squares regression on the provided data.
We will model average CO2 (in ppm) as a function of decimal year and then model average N2O (in ppb) as a function of decimal year.
The function must
Perform linear regression on the data to get the least-squares coefficients, first for CO2 and then for N2O.
Determine the predicted values of each linear model.
Calculate SSE, SST, and r2 values for each model.
Display the linear model equation (with clear variable names), SSE, SST, and r2 to the Command Window for each model. Make sure you can differentiate between the information for CO2 and N2O.
Generate one figure with two subplots stacked vertically. On the top subplot, display the data and the trend line on the same axes for CO2. On the bottom subplot, display the data and trend line on the same axes for N2O. Format both subplots and the figure for technical presentation.
-Learn about the xlim function to set the x-axis limits of both subplots.
Make your subplots have identical axes limits on the x-axis and show all data in both subplots.
Q1. From your analyses, can you draw a conclusion about the accuracy of the data measurements? Provide justification for your answer.
Q2. For which data set does a linear model best explain the variation that exists in the data? Clearly state the basis of your reasoning and provide justification for your answer.
There are more rows of data in the present columns. So how can I individually import data from csv and txt files with data being set to different variables?
Data_NOAA_ESRL_CO2_trend_1980-2000 global.csv
N2O data in the file Data_NOAA_ESRL_N2O_trend_2001-2022.txt.
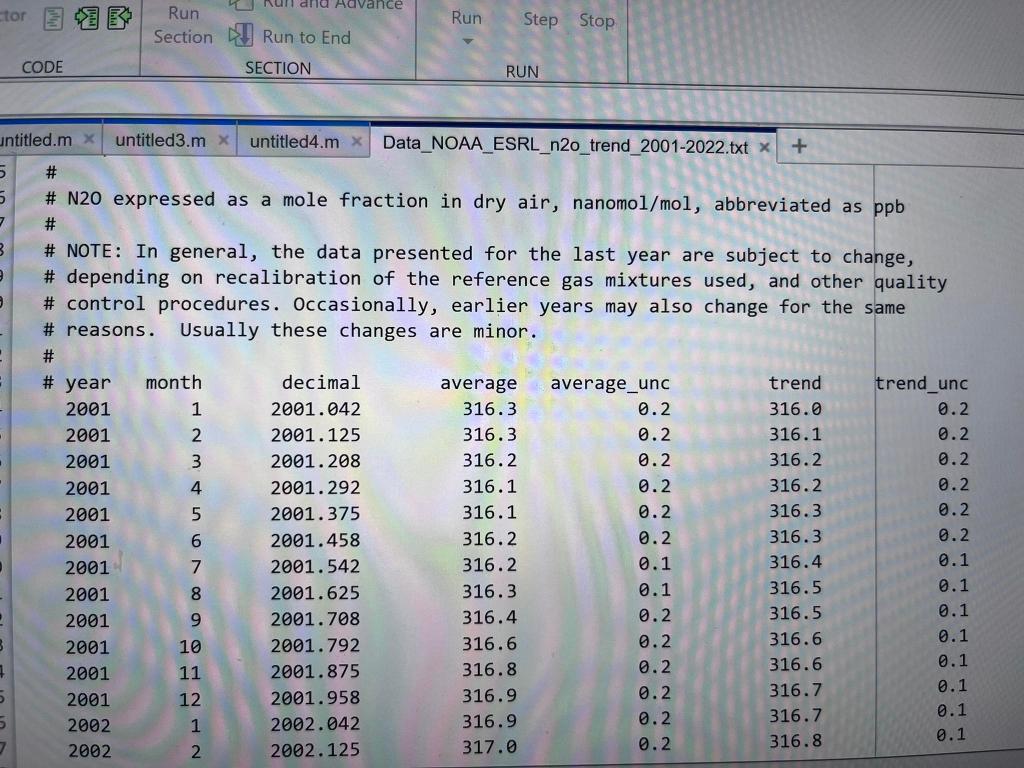
UTF-8 CRLF script Ln 2Col22 \# N20 expressed as a mole fraction in dry air, nanomol/mol, abbreviated as ppb # \# NOTE: In general, the data presented for the last year are subject to change, \# depending on recalibration of the reference gas mixtures used, and other quality \# control procedures. Occasionally, earlier years may also change for the same \# reasons. Usually these changes are minor
Step by Step Solution
There are 3 Steps involved in it

Get step-by-step solutions from verified subject matter experts