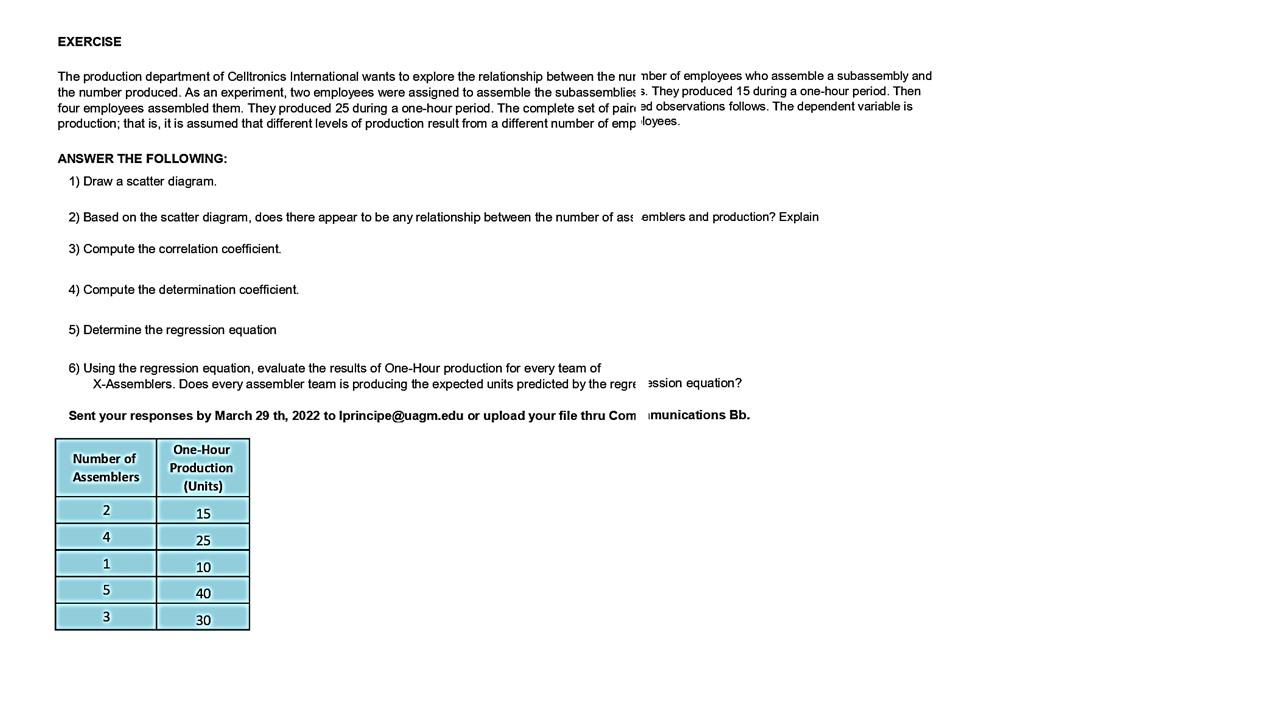
Question: I need to use the exercise step by step, using excel. EXERCISE The production department of Celltronics International wants to explore the relationship between the

I need to use the exercise step by step, using excel.

I need to use the exercise step by step, using

EXERCISE The production department of Celltronics International wants to explore the relationship between the nur nber of employees who assemble a subassembly and the number produced. As an experiment, two employees were assigned to assemble the subassemblies 3. They produced 15 during a one-hour period. Then four employees assembled them. They produced 25 during a one-hour period. The complete set of pain ad observations follows. The dependent variable is production; that is, it is assumed that different levels of production result from a different number of employees. ANSWER THE FOLLOWING: 1) Draw a scatter diagram. 2) Based on the scatter diagram, does there appear to be any relationship between the number of as: emblers and production? Explain 3) Compute the correlation coefficient 4) Compute the determination coefficient. 5) Determine the regression equation 6) Using the regression equation, evaluate the results of One-Hour production for every team of X-Assemblers. Does every assembler team is producing the expected units predicted by the regression equation? Sent your responses by March 29th, 2022 to Iprincipe Quagm.edu or upload your file thru Communications Bb. Number of Assemblers One-Hour Production (Units) 2 15 4 25 1 10 5 40 3 30

Step by Step Solution

There are 3 Steps involved in it

1 Expert Approved Answer
Step: 1 Unlock blur-text-image
Question Has Been Solved by an Expert!

Get step-by-step solutions from verified subject matter experts

Step: 2 Unlock
Step: 3 Unlock

Students Have Also Explored These Related General Management Questions!