

Question: i need you please to complete the code in python training dataset 100 80- 60 40- 20 0 0 20 40 60 80 100 X
i need you please to complete the code in python
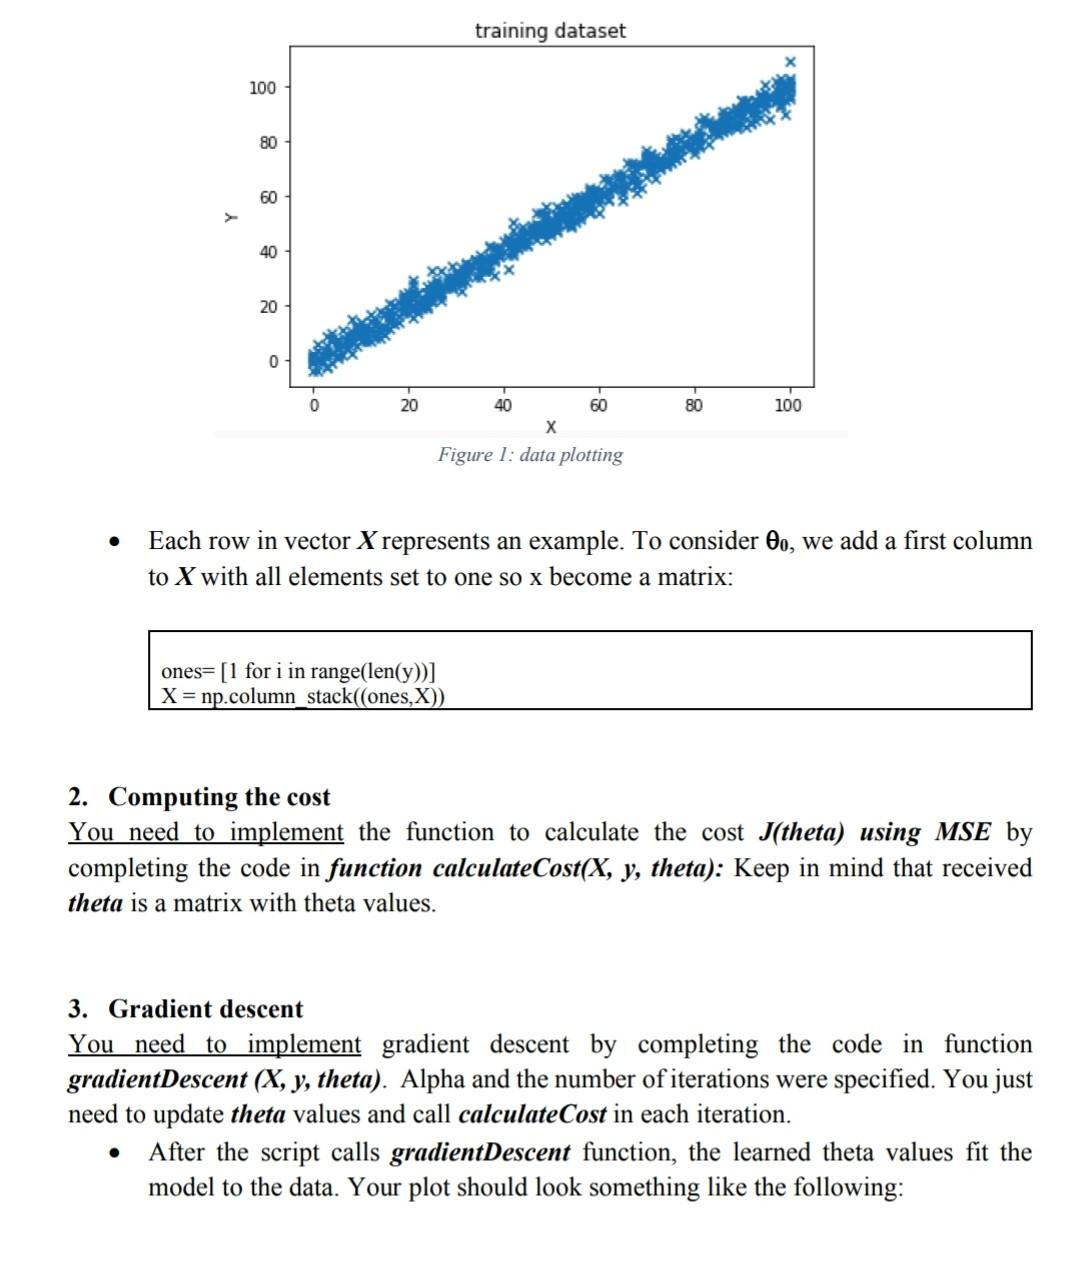
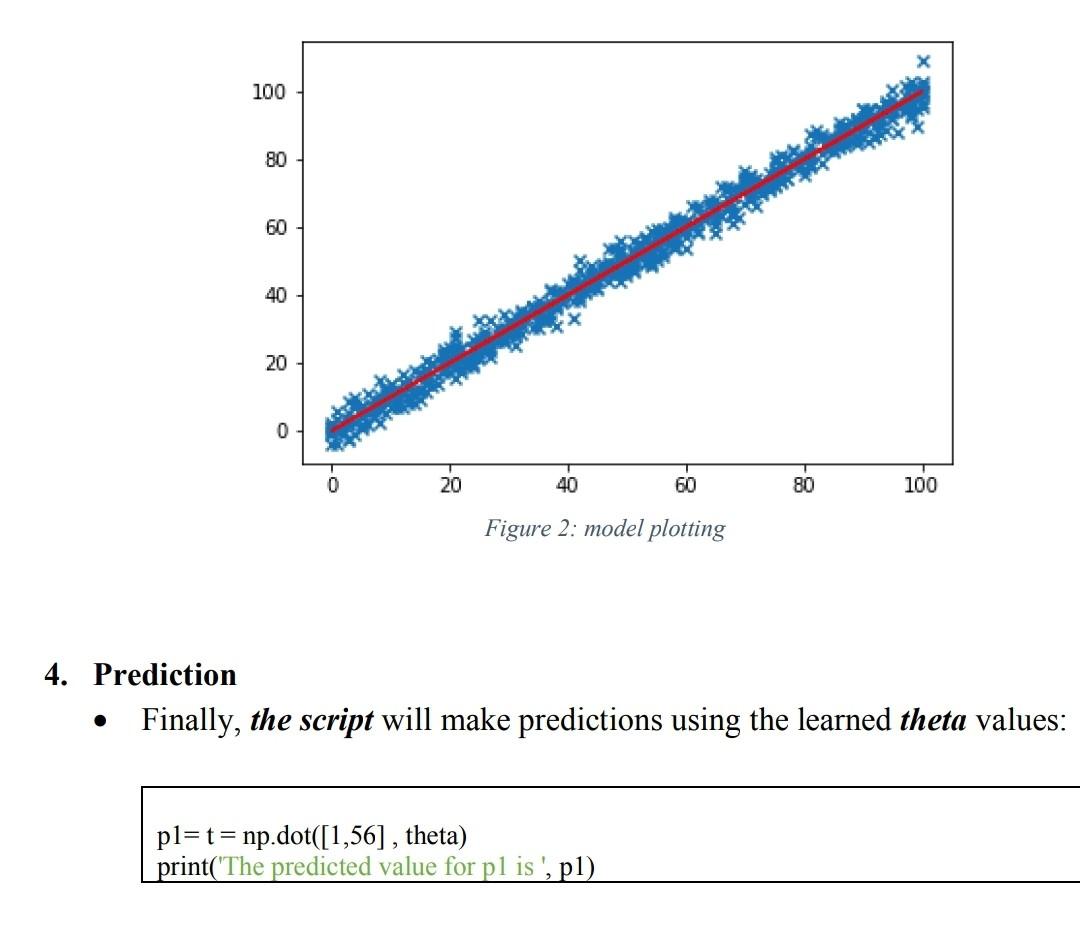
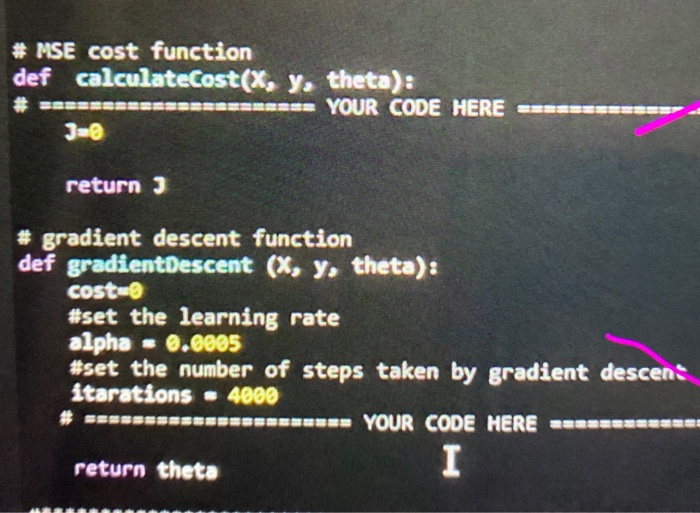
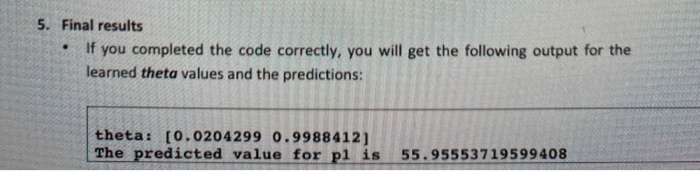
training dataset 100 80- 60 40- 20 0 0 20 40 60 80 100 X Figure 1: data plotting Each row in vector X represents an example. To consider Oo, we add a first column to X with all elements set to one so x become a matrix: ones= [1 for i in range(len(y))] X = np.column stack((ones,X)) 2. Computing the cost You need to implement the function to calculate the cost J(theta) using MSE by completing the code in function calculateCost(X, y, theta): Keep in mind that received theta is a matrix with theta values. 3. Gradient descent You need to implement gradient descent by completing the code in function gradientDescent (x, y, theta). Alpha and the number of iterations were specified. You just need to update theta values and call calculateCost in each iteration. After the script calls gradientDescent function, the learned theta values fit the model to the data. Your plot should look something like the following: 100 BO 60 40 20 0 20 40 60 80 100 Figure 2: model plotting 4. Prediction Finally, the script will make predictions using the learned theta values: . = pl=t= np.dot([1,56], theta) print('The predicted value for pl is', pl) # MSE cost function def calculateCost(x, y, theta): # 3 muss. YOUR CODE HERE return 3 # gradient descent function def gradientDescent (x, y, theta): costa #set the learning rate alpha @.2005 #set the number of steps taken by gradient descens itarations 4000 # SESS- - YOUR CODE HERE I return theta 5. Final results If you completed the code correctly, you will get the following output for the learned theta values and the predictions: . theta: [0.0204299 0.9988412) The predicted value for pl is 55.95553719599408 training dataset 100 80- 60 40- 20 0 0 20 40 60 80 100 X Figure 1: data plotting Each row in vector X represents an example. To consider Oo, we add a first column to X with all elements set to one so x become a matrix: ones= [1 for i in range(len(y))] X = np.column stack((ones,X)) 2. Computing the cost You need to implement the function to calculate the cost J(theta) using MSE by completing the code in function calculateCost(X, y, theta): Keep in mind that received theta is a matrix with theta values. 3. Gradient descent You need to implement gradient descent by completing the code in function gradientDescent (x, y, theta). Alpha and the number of iterations were specified. You just need to update theta values and call calculateCost in each iteration. After the script calls gradientDescent function, the learned theta values fit the model to the data. Your plot should look something like the following: 100 BO 60 40 20 0 20 40 60 80 100 Figure 2: model plotting 4. Prediction Finally, the script will make predictions using the learned theta values: . = pl=t= np.dot([1,56], theta) print('The predicted value for pl is', pl) # MSE cost function def calculateCost(x, y, theta): # 3 muss. YOUR CODE HERE return 3 # gradient descent function def gradientDescent (x, y, theta): costa #set the learning rate alpha @.2005 #set the number of steps taken by gradient descens itarations 4000 # SESS- - YOUR CODE HERE I return theta 5. Final results If you completed the code correctly, you will get the following output for the learned theta values and the predictions: . theta: [0.0204299 0.9988412) The predicted value for pl is 55.95553719599408
Step by Step Solution
There are 3 Steps involved in it

Get step-by-step solutions from verified subject matter experts