

Question: I need you to help me analyze these 2 graphs and explain each one in detail. These graphs were obtained from a Mountain Dew experiment.
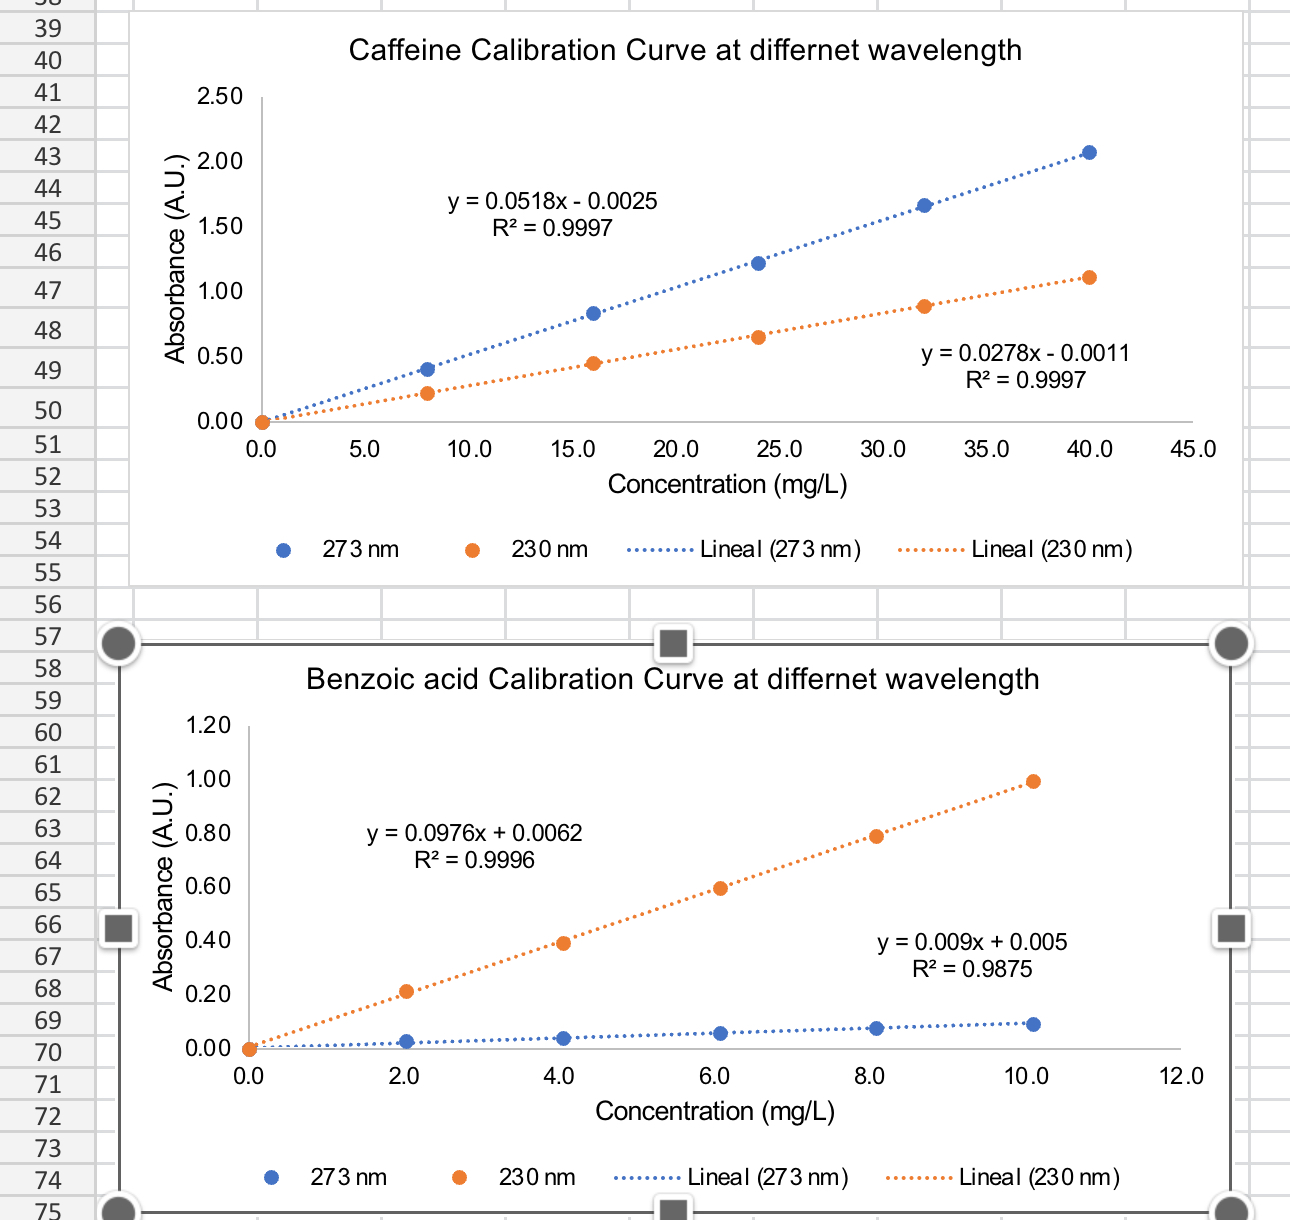
I need you to help me analyze these graphs and explain each one in detail. These graphs were obtained from a Mountain Dew experiment. In this experiment, UV absorbance will be used to measure two major components in Mountain Dew:caffeine and sodium benzoate. Caffeine is added as a stimulant and sodium benzoate as a preservativein most soft drinks. I need you to analyze the graph and describe everything about what you see, letting yourself go because in the experiment we are comparing caffeine with Mountain Dew and benzoic acid with Mountain Dew and give me an analysis explaining both graphs separately and at the end a comparison of both graphs.Caffeine Calibration Curve at Different wavelength benzoic acid calibration curve. Compare both graphs and analyze.
Step by Step Solution
There are 3 Steps involved in it
1 Expert Approved Answer
Step: 1 Unlock

Question Has Been Solved by an Expert!
Get step-by-step solutions from verified subject matter experts
Step: 2 Unlock
Step: 3 Unlock