

Question: Please help with discussion questions using my data Discussion Questions: 1. Do your linear graphs in Part A confirm Beer's Law? Briefly explain. 2. How
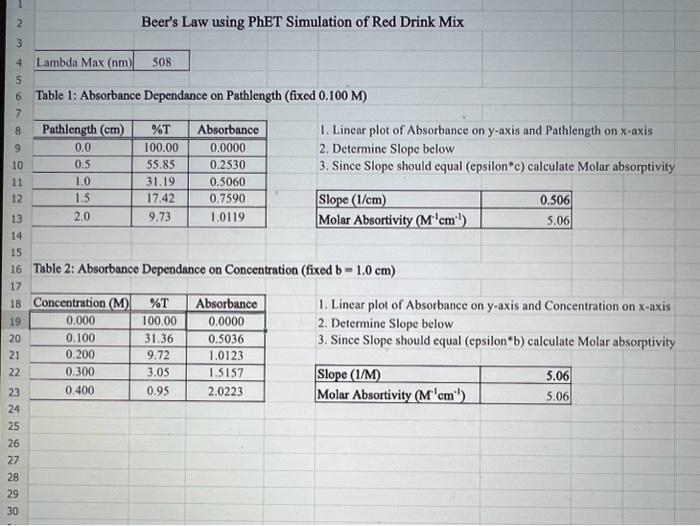
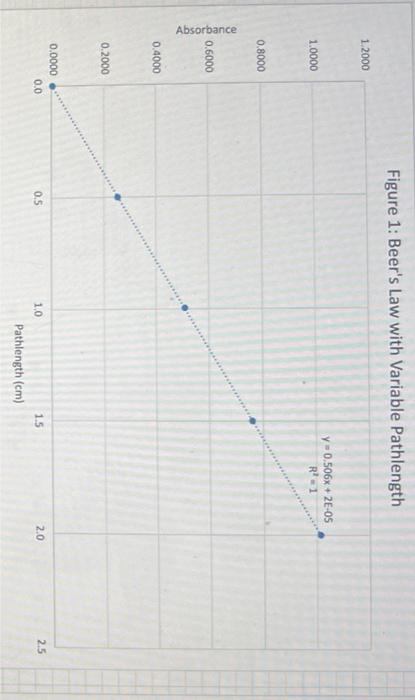
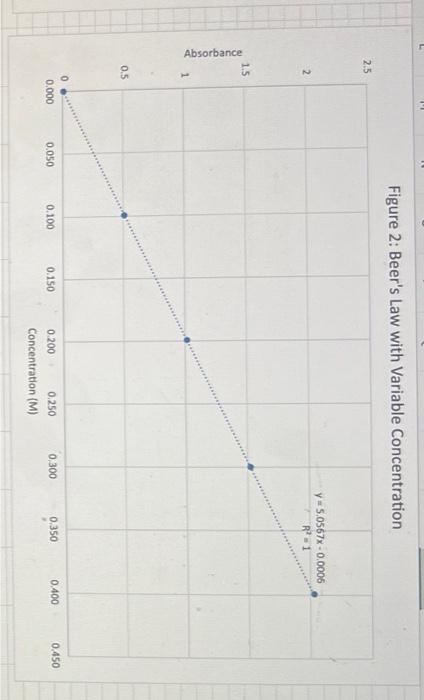
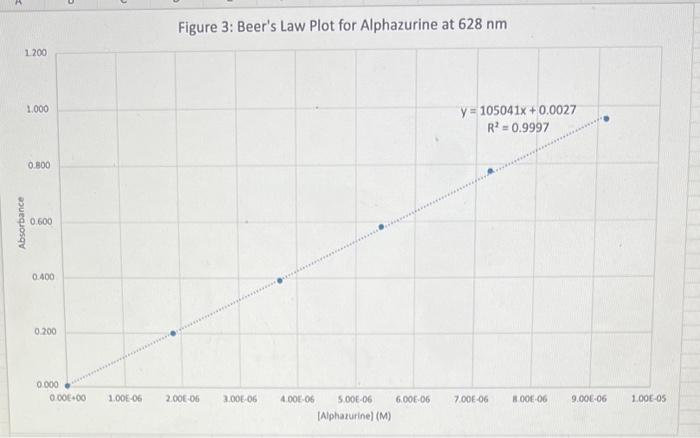
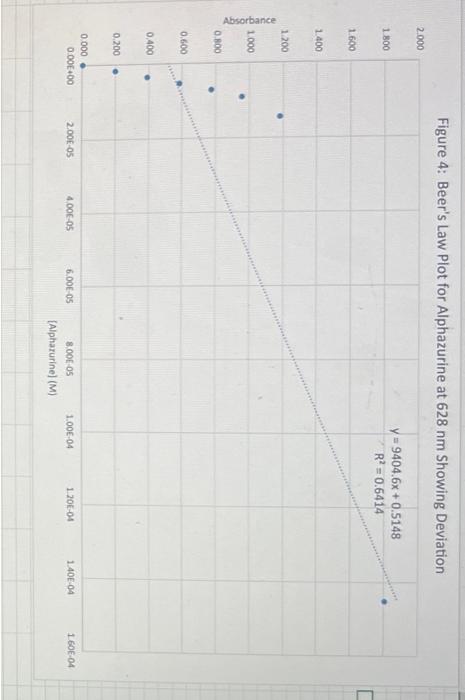
Discussion Questions: 1. Do your linear graphs in Part A confirm Beer's Law? Briefly explain. 2. How well do your Molar absorptivities compare in Part A? Explain why or why not this is expected. 3. For Part B (Graph 3 and the determinations of the Unknowns), do the results show more of a Random Error or a Systematic Error? Briefly explain. 4. In Part B, if we set the wavelength to 530nm instead of 630nm, how would this change the results of this experiment. (Hint - look at last week's graph of the blue solution to help you answer this.) 5. If we had a sample of this blue solution that was too concentrated (beyond the linear range), how could we still analyze the concentration of this unknown? Beer's Law using PhET Simulation of Red Drink Mix Table 1: Absorbance Dependance on Pathlength (fixed 0.100M ) 1. Linear plot of Absorbance on y-axis and Pathlength on x-axis 2. Determine Slope below 3. Since Slope should equal (epsilon*c) calculate Molar absorptivity Table 2: Absorbance Dependance on Concentration (fixed b=1.0cm ) 1. Linear plot of Absorbance on y-axis and Concentration on x-axis 2. Determine Slope below 3. Since Slope should equal (epsilon*b) calculate Molar absorptivity Figure 1: Beer's Law with Variable Pathlength Ciauro ). Roor'c I aw with Variable Concentration Figure 3: Beer's Law Plot for Alphazurine at 628nm Figure 4: Beer's Law Plot for Alphazurine at 628nm Showing Deviation Discussion Questions: 1. Do your linear graphs in Part A confirm Beer's Law? Briefly explain. 2. How well do your Molar absorptivities compare in Part A? Explain why or why not this is expected. 3. For Part B (Graph 3 and the determinations of the Unknowns), do the results show more of a Random Error or a Systematic Error? Briefly explain. 4. In Part B, if we set the wavelength to 530nm instead of 630nm, how would this change the results of this experiment. (Hint - look at last week's graph of the blue solution to help you answer this.) 5. If we had a sample of this blue solution that was too concentrated (beyond the linear range), how could we still analyze the concentration of this unknown? Beer's Law using PhET Simulation of Red Drink Mix Table 1: Absorbance Dependance on Pathlength (fixed 0.100M ) 1. Linear plot of Absorbance on y-axis and Pathlength on x-axis 2. Determine Slope below 3. Since Slope should equal (epsilon*c) calculate Molar absorptivity Table 2: Absorbance Dependance on Concentration (fixed b=1.0cm ) 1. Linear plot of Absorbance on y-axis and Concentration on x-axis 2. Determine Slope below 3. Since Slope should equal (epsilon*b) calculate Molar absorptivity Figure 1: Beer's Law with Variable Pathlength Ciauro ). Roor'c I aw with Variable Concentration Figure 3: Beer's Law Plot for Alphazurine at 628nm Figure 4: Beer's Law Plot for Alphazurine at 628nm Showing Deviation
Step by Step Solution
There are 3 Steps involved in it

Get step-by-step solutions from verified subject matter experts