

Question: i needed help with this problems Section 2) ) BRICS & Nigeria have decided to collaborate and select the combination of sites that is collectively
i needed help with this problems
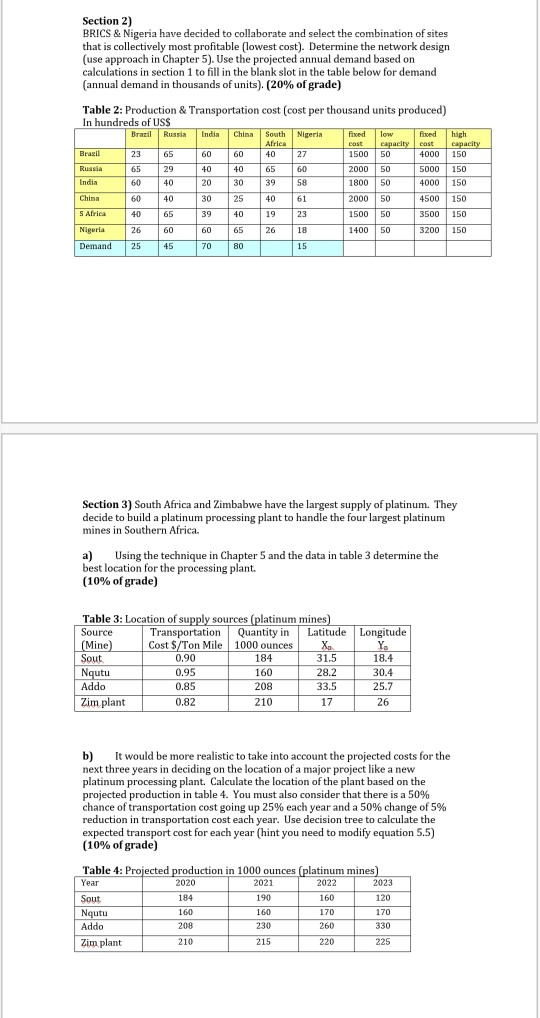
Section 2) ) BRICS & Nigeria have decided to collaborate and select the combination of sites that is collectively most profitable (lowest cost). Determine the network design (use approach in Chapter 5). Use the projected annual demand based on calculations in section 1 to fill in the blank slot in the table below for demand (annual demand in thousands of units). (20% of grade) Table 2: Production & Transportation cost (cost per thousand units produced) In hundreds of USS Brazil Russia India China South Nigeria fixed low fied high Africa cost capacity cost capacity Brasil 23 65 60 60 40 27 1500 50 4000 150 Russia 65 20 29 40 40 65 60 2000 50 5000 150 India 60 40 20 30 39 58 1800 50 4000 150 China 60 40 30 25 40 61 2000 50 4500 150 S Africa 40 65 39 40 19 23 1500 50 3500 150 Nigeria 26 60 60 65 26 18 1400 50 3200 150 Demand 25 45 70 80 15 Section 3) South Africa and Zimbabwe have the largest supply of platinum. They decide to build a platinum processing plant to handle the four largest platinum mines in Southern Africa. Using the technique in Chapter 5 and the data in table 3 determine the best location for the processing plant. (10% of grade) Table 3: Location of supply sources (platinum mines) Source Transportation Quantity in Latitude Longitude (Mine) Cost $/Ton Mile 1000 ounces X. Y. Sout 0.90 184 31.5 18.4 Nqutu 0.95 160 28.2 30.4 Addo 0.85 208 33.5 25.7 Zim plant 0.82 210 17 26 b) It would be more realistic to take into account the projected costs for the next three years in deciding on the location of a major project like a new platinum processing plant Calculate the location of the plant based on the projected production in table 4. You must also consider that there is a 50% chance of transportation cost going up 25% each year and a 50% change of 5% reduction in transportation cost each year. Use decision tree to calculate the expected transport cost for each year (hint you need to modify equation 5.5) (10% of grade) Table 4: Projected production in 1000 ounces (platinum mines) Year 2020 2021 2022 2023 Sout 184 190 160 120 Nqutu 160 160 170 170 Addo 208 230 260 330 Zimplant 210 215 220 225 Section 2) ) BRICS & Nigeria have decided to collaborate and select the combination of sites that is collectively most profitable (lowest cost). Determine the network design (use approach in Chapter 5). Use the projected annual demand based on calculations in section 1 to fill in the blank slot in the table below for demand (annual demand in thousands of units). (20% of grade) Table 2: Production & Transportation cost (cost per thousand units produced) In hundreds of USS Brazil Russia India China South Nigeria fixed low fied high Africa cost capacity cost capacity Brasil 23 65 60 60 40 27 1500 50 4000 150 Russia 65 20 29 40 40 65 60 2000 50 5000 150 India 60 40 20 30 39 58 1800 50 4000 150 China 60 40 30 25 40 61 2000 50 4500 150 S Africa 40 65 39 40 19 23 1500 50 3500 150 Nigeria 26 60 60 65 26 18 1400 50 3200 150 Demand 25 45 70 80 15 Section 3) South Africa and Zimbabwe have the largest supply of platinum. They decide to build a platinum processing plant to handle the four largest platinum mines in Southern Africa. Using the technique in Chapter 5 and the data in table 3 determine the best location for the processing plant. (10% of grade) Table 3: Location of supply sources (platinum mines) Source Transportation Quantity in Latitude Longitude (Mine) Cost $/Ton Mile 1000 ounces X. Y. Sout 0.90 184 31.5 18.4 Nqutu 0.95 160 28.2 30.4 Addo 0.85 208 33.5 25.7 Zim plant 0.82 210 17 26 b) It would be more realistic to take into account the projected costs for the next three years in deciding on the location of a major project like a new platinum processing plant Calculate the location of the plant based on the projected production in table 4. You must also consider that there is a 50% chance of transportation cost going up 25% each year and a 50% change of 5% reduction in transportation cost each year. Use decision tree to calculate the expected transport cost for each year (hint you need to modify equation 5.5) (10% of grade) Table 4: Projected production in 1000 ounces (platinum mines) Year 2020 2021 2022 2023 Sout 184 190 160 120 Nqutu 160 160 170 170 Addo 208 230 260 330 Zimplant 210 215 220 225Step by Step Solution
There are 3 Steps involved in it
1 Expert Approved Answer
Step: 1 Unlock

Question Has Been Solved by an Expert!
Get step-by-step solutions from verified subject matter experts
Step: 2 Unlock
Step: 3 Unlock