

Question: Section 1) calculate the demand for next four quarters for Russia. Use the different forecasting techniques, perform error analysis and select the technique that is
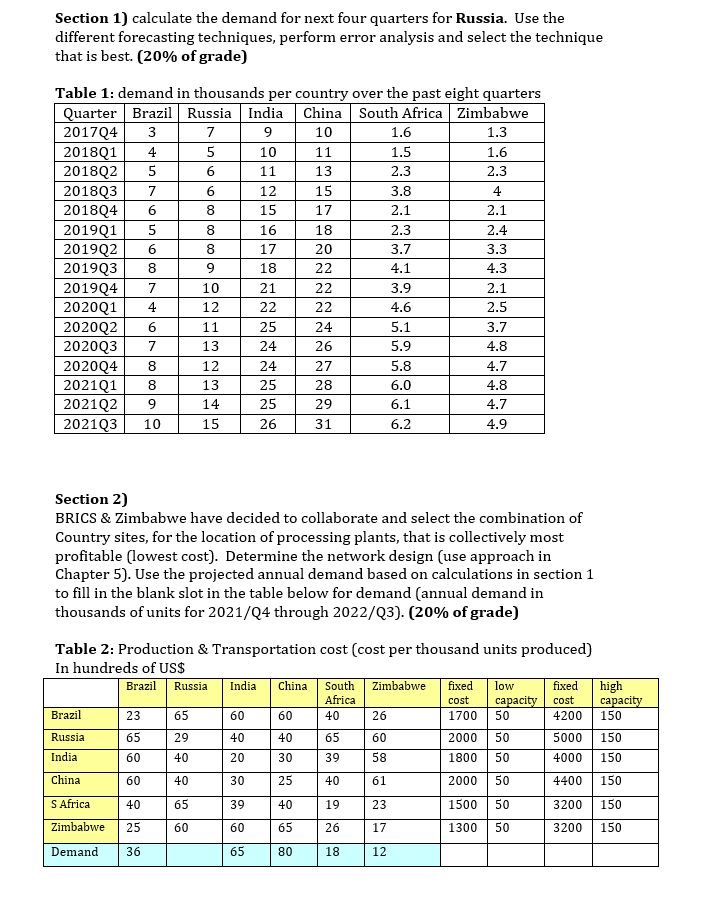
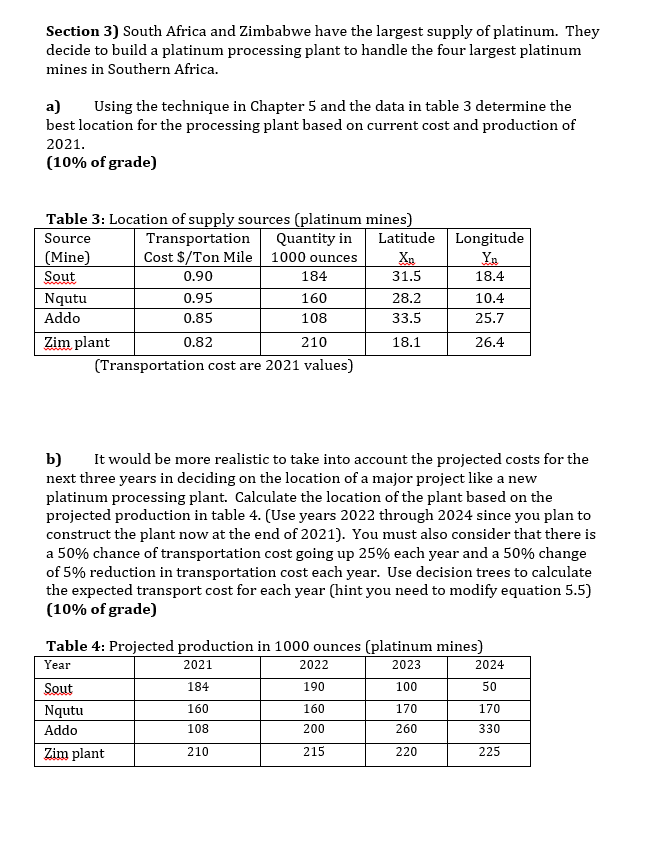
Section 1) calculate the demand for next four quarters for Russia. Use the different forecasting techniques, perform error analysis and select the technique that is best. (20% of grade) Table 1: demand in thousands per country over the past eight quarters Quarter Brazil Russia India China South Africa | Zimbabwe 2017Q4 3 7 9 10 1.6 1.3 2018Q1 4 5 10 11 1.5 1.6 2018Q2 5 6 11 13 2.3 2.3 2018Q3 7 6 12 15 3.8 4 201804 6 8 15 17 2.1 2.1 2019Q1 5 8 16 18 2.3 2.4 2019Q2 6 8 17 20 3.7 3.3 2019Q3 8 9 18 22 4.1 4.3 201904 10 21 22 3.9 2.1 2020Q1 12 22 22 4.6 2.5 2020Q2 6 11 25 24 5.1 3.7 2020Q3 13 24 26 5.9 1.8 2020Q4 12 24 27 5.8 1.7 2021Q1 8 13 25 28 6.0 4.8 2021Q2 g 14 25 29 6.1 4.7 2021Q3 10 15 26 31 6.2 4.9 Section 2) BRICS & Zimbabwe have decided to collaborate and select the combination of Country sites, for the location of processing plants, that is collectively most profitable (lowest cost). Determine the network design (use approach in Chapter 5). Use the projected annual demand based on calculations in section 1 to fill in the blank slot in the table below for demand (annual demand in thousands of units for 2021/Q4 through 2022/Q3). (20% of grade) Table 2: Production & Transportation cost (cost per thousand units produced) In hundreds of US$ Brazil Russia India China South Zimbabwe fixed low fixed high Africa cost capacity Brazi cost capacity 23 65 60 60 40 26 1700 50 +200 150 Russia 65 29 40 65 60 2000 50 5000 150 India 60 40 20 30 39 58 1800 50 4000 150 China 60 40 30 25 40 61 2000 50 1400 150 S Africa 40 30 40 19 23 1500 50 3200 150 Zimbabwe 25 60 60 65 26 17 1300 50 3200 150 Demand 36 65 80 18 12Section 3] South Africa and Eimbabwe have the largest supply of platinum. They decide to build a platinum processing plant to handle the four largest platinum mines in Southern Africa. a] Using the technique in Chapter 5 and the data in table 3 determine the best location for the processing plant based on current cost and production of 2021. [10% of grade] Table 3: Location of supply sources [platinum mines] Source Transportation Quantity in Latitude Longitude {Mine} Ililost 3 f Ton Mile l ounces h in m\" m [Transportation cost are 2031 values] b] It would be more realistic to take into account the projected costs for the next three years in deciding on the location of a major project like a new platinum processing plant Calculate the location of the plant based on the projected production in table 4-. [Use years 2032 through 2&24 since you plan to construct the plant now at the end of 3021]. You must also consider that there is a 50% chance of transportation cost going up 25% each year and a 50% change of 5% reduction in transportation cost each year. Use decision trees to calculate the expected transport cost for each year [hint you need to modify equation 5.5] [1 [1% of grade] Table 4.: Projected production in 1mm ounces [platinum mines]
Step by Step Solution
There are 3 Steps involved in it

Get step-by-step solutions from verified subject matter experts