

Question: I not sure the scatterplot is correct and does not know how to write the b and c Include a copy of your JMP output
- I not sure the scatterplot is correct and does not know how to write the b and c
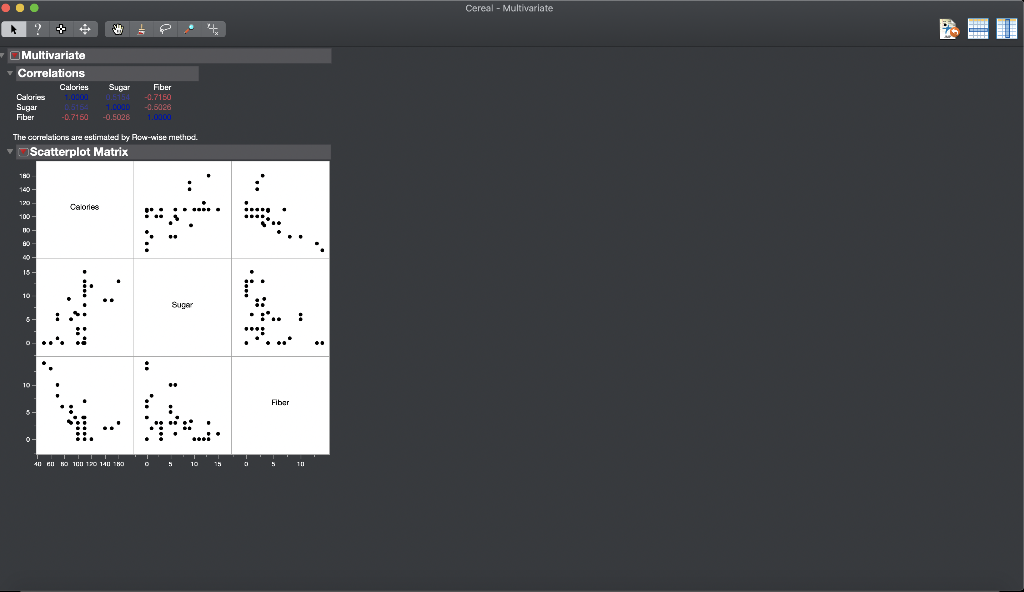
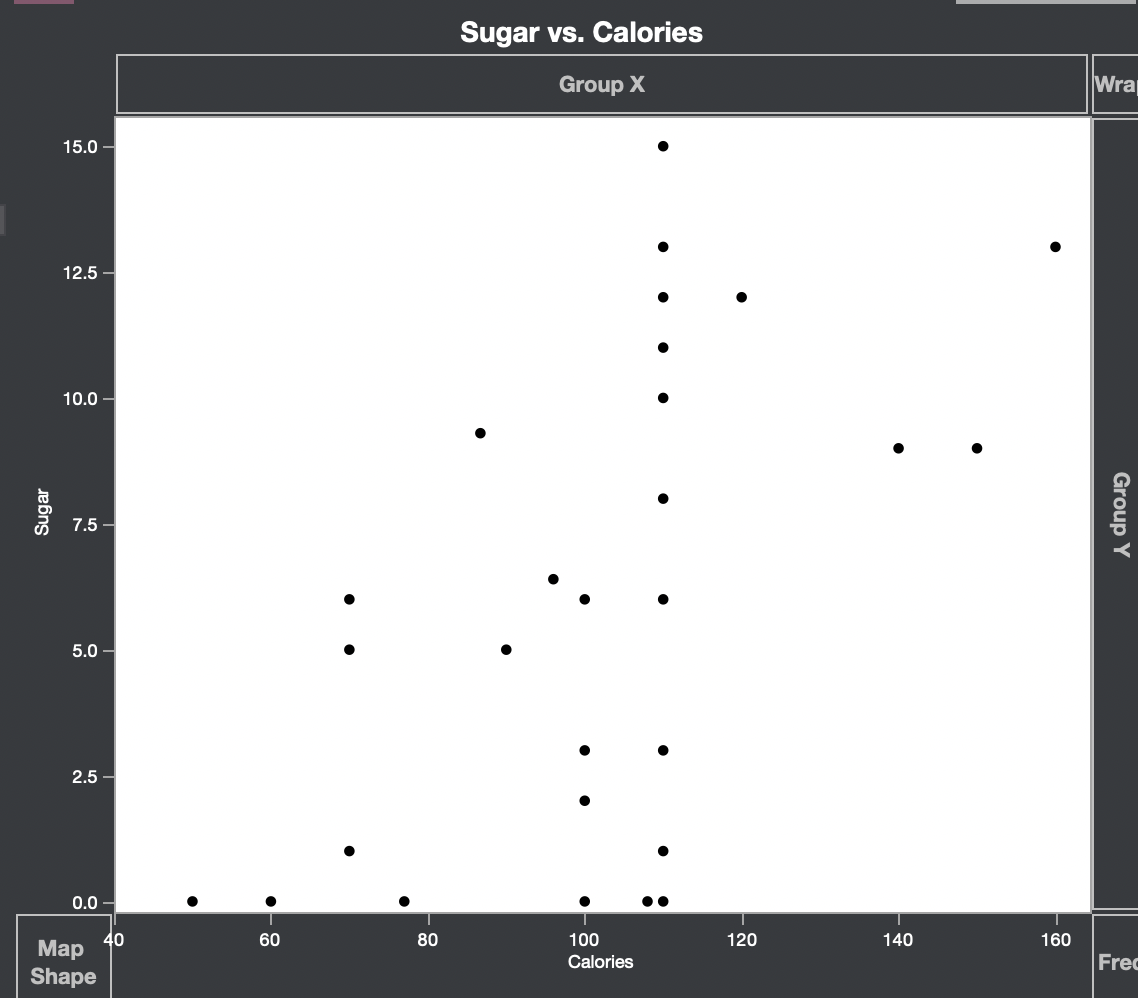
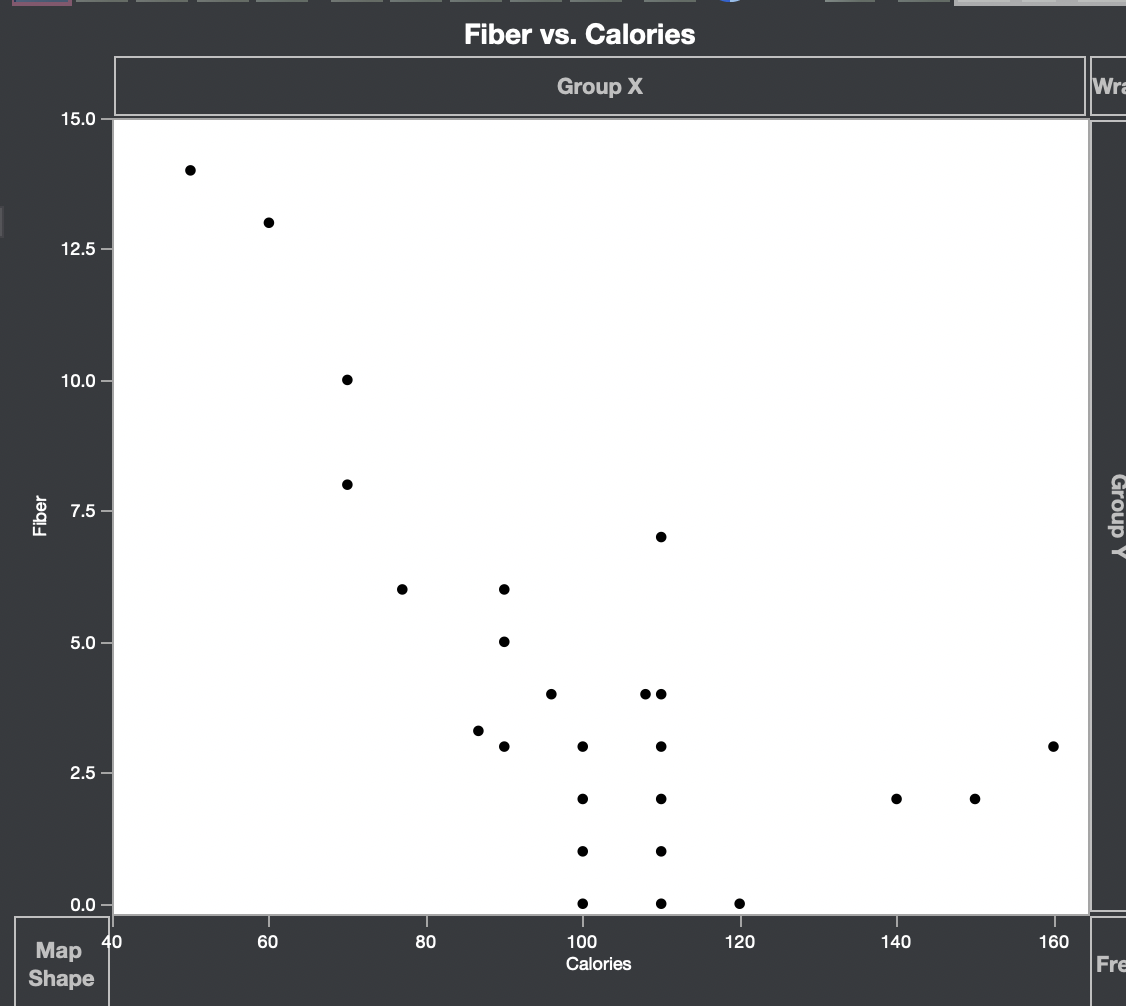
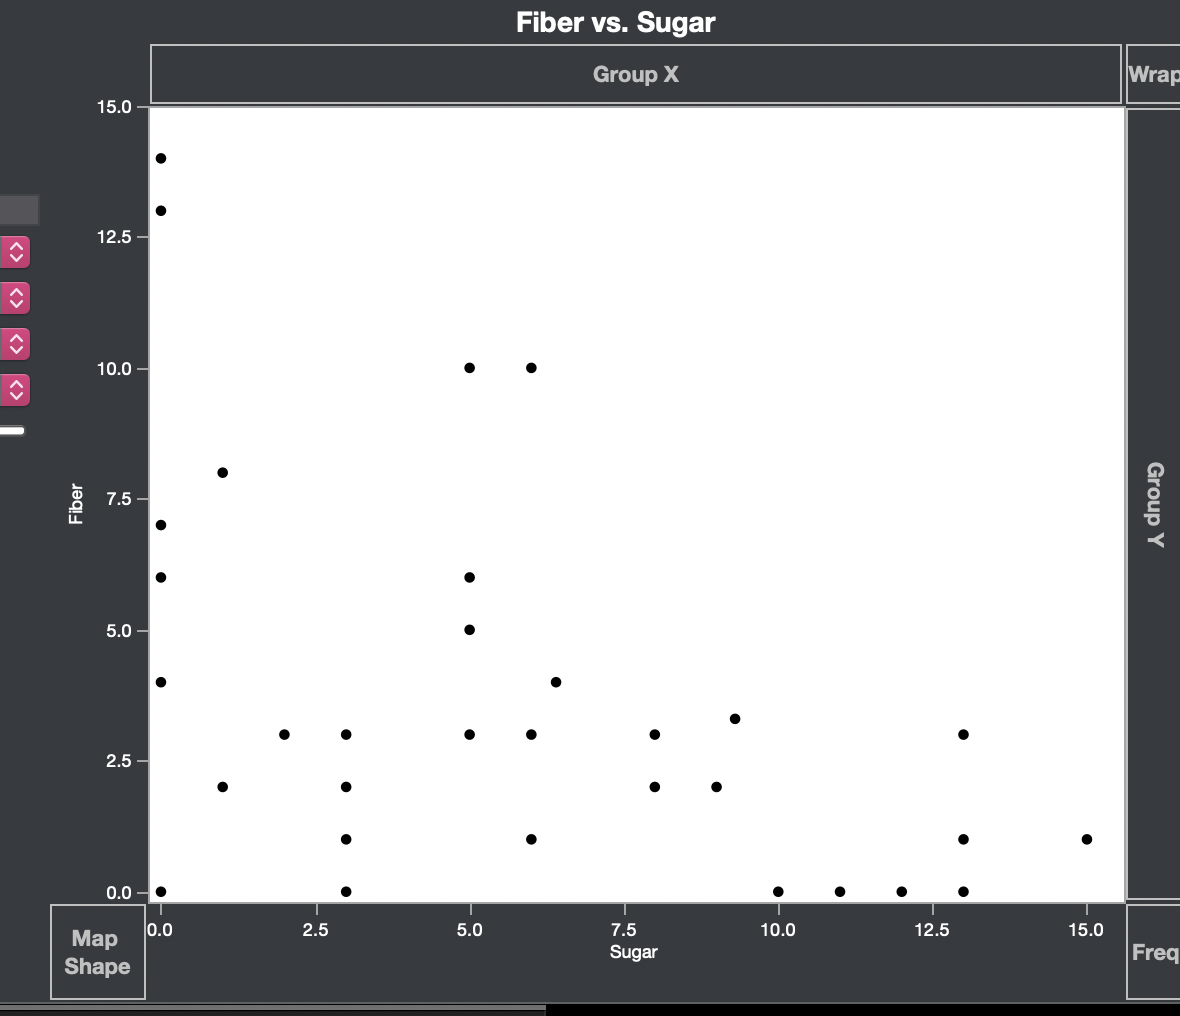
- Include a copy of your JMP output and interpret the scatterplot. Do not forget to discuss form, direction, strength, and presence/absence of outliers.
-
- Least squares regression equation:
- Interpret slope:
here is the data
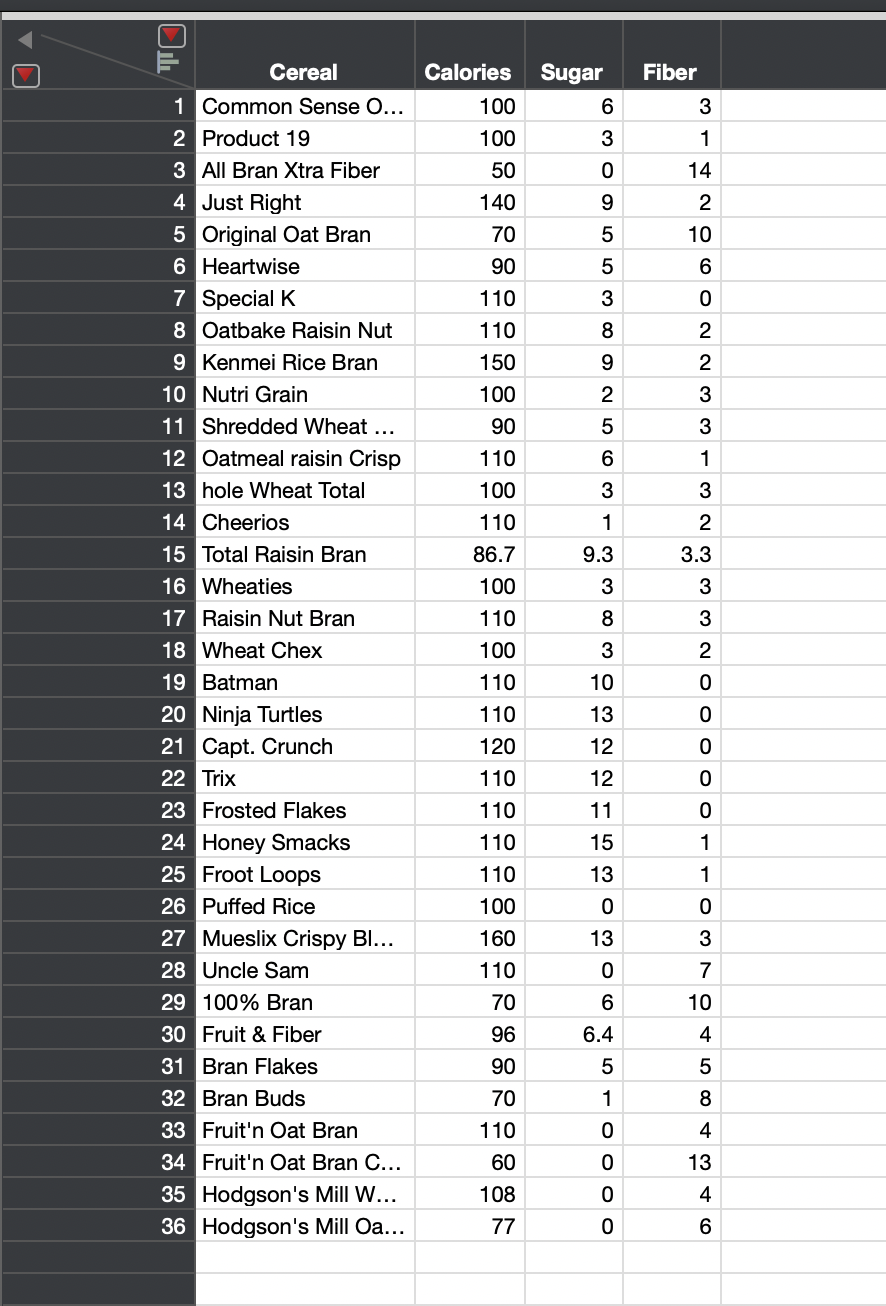
Common Sense Oat Bran 100 6 3 Product 19 100 3 1 All Bran Xtra Fiber 50 0 14 Just Right 140 9 2 Original Oat Bran 70 5 10 Heartwise 90 5 6 Special K 110 3 0 Oatbake Raisin Nut 110 8 2 Kenmei Rice Bran 150 9 2 Nutri Grain 100 2 3 Shredded Wheat Squares 90 5 3 Oatmeal raisin Crisp 110 6 1 hole Wheat Total 100 3 3 Cheerios 110 1 2 Total Raisin Bran 86.7 9.3 3.3 Wheaties 100 3 3 Raisin Nut Bran 110 8 3 Wheat Chex 100 3 2 Batman 110 10 0 Ninja Turtles 110 13 0 Capt. Crunch 120 12 0 Trix 110 12 0 Frosted Flakes 110 11 0 Honey Smacks 110 15 1 Froot Loops 110 13 1 Puffed Rice 100 0 0 Mueslix Crispy Blend 160 13 3 Uncle Sam 110 0 7 100% Bran 70 6 10 Fruit & Fiber 96 6.4 4 Bran Flakes 90 5 5 Bran Buds 70 1 8 Fruit'n Oat Bran 110 0 4 Fruit'n Oat Bran Crunch 60 0 13 Hodgson's Mill Wheat 108 0 4 Hodgson's Mill Oat Bran 77 0 6
here is scatterplot, but I not sure the first is correct or not. and the second one to last one are also not sure
Calories Fiber Sugar 6 3 1 100 100 50 140 14 U 0 O W 0 9 2 10 6 3 70 90 110 110 150 100 8 2 9 2 2 3 3 6 1 LO , 3 3 1 2 9.3 3.3 3 3 8 3 Cereal 1 Common Sense O... 2 Product 19 3 All Bran Xtra Fiber 4 Just Right 5 Original Oat Bran 6 Heartwise 7 Special K 8 Oatbake Raisin Nut 9 Kenmei Rice Bran 10 Nutri Grain 11 Shredded Wheat ... 12 Oatmeal raisin Crisp 13 hole Wheat Total 14 Cheerios 15 Total Raisin Bran 16 Wheaties 17 Raisin Nut Bran 18 Wheat Chex 19 Batman 20 Ninja Turtles 21 Capt. Crunch 22 Trix 23 Frosted Flakes 24 Honey Smacks 25 Froot Loops 26 Puffed Rice 27 Mueslix Crispy BI... 28 Uncle Sam 29 100% Bran 30 Fruit & Fiber 31 Bran Flakes 32 Bran Buds 33 Fruit'n Oat Bran 34 Fruit'n Oat Bran C... 35 Hodgson's Mill W... 36 Hodgson's Mill Oa... 3 2 0 90 110 100 110 86.7 100 110 100 110 110 120 110 110 110 110 100 160 110 0 10 13 12 12 0 0 0 11 15 13 1 1 0 0 13 3 0 7 70 6 10 96 6.4 4 90 5 5 1 70 110 8 4 0 60 0 13 108 0 4 77 0 6 . Cereal - Multivariate 1 . 4 Multivariate Correlations Calories Calories Suga Fiber -0.7150 Sugar Fiber 0.7150 -0.5026 1.0000 -0.5028 The correlations are estimated by Row-wise method. Scatterplot Matrix 180 140 120 Calories Sugar Fiber 40 e NO 100 130 140 10 Sugar vs. Calories Group X Wra 15.0 - 12.5 10.0 Sugar Group Y 7.5 5.0 2.5 0.0 .. 60 80 120 140 160 40 Map Shape 100 Calories Frec Fiber vs. Calories Group X Wra 15.0 12.5 10.0 Fiber 7.5 Group Y 5.0 .. 2.5 0.0 T 160 60 80 120 140 40 Map Shape 100 Calories Fre Fiber vs. Sugar Group X Wrap 15.0 12.5 - 10.0 Fiber 7.5 Group Y 5.0 2.5 - 0.0-O 2.5 5.0 10.0 12.5 15.0 0.0 Map Shape 7.5 Sugar Freq Calories Fiber Sugar 6 3 1 100 100 50 140 14 U 0 O W 0 9 2 10 6 3 70 90 110 110 150 100 8 2 9 2 2 3 3 6 1 LO , 3 3 1 2 9.3 3.3 3 3 8 3 Cereal 1 Common Sense O... 2 Product 19 3 All Bran Xtra Fiber 4 Just Right 5 Original Oat Bran 6 Heartwise 7 Special K 8 Oatbake Raisin Nut 9 Kenmei Rice Bran 10 Nutri Grain 11 Shredded Wheat ... 12 Oatmeal raisin Crisp 13 hole Wheat Total 14 Cheerios 15 Total Raisin Bran 16 Wheaties 17 Raisin Nut Bran 18 Wheat Chex 19 Batman 20 Ninja Turtles 21 Capt. Crunch 22 Trix 23 Frosted Flakes 24 Honey Smacks 25 Froot Loops 26 Puffed Rice 27 Mueslix Crispy BI... 28 Uncle Sam 29 100% Bran 30 Fruit & Fiber 31 Bran Flakes 32 Bran Buds 33 Fruit'n Oat Bran 34 Fruit'n Oat Bran C... 35 Hodgson's Mill W... 36 Hodgson's Mill Oa... 3 2 0 90 110 100 110 86.7 100 110 100 110 110 120 110 110 110 110 100 160 110 0 10 13 12 12 0 0 0 11 15 13 1 1 0 0 13 3 0 7 70 6 10 96 6.4 4 90 5 5 1 70 110 8 4 0 60 0 13 108 0 4 77 0 6 . Cereal - Multivariate 1 . 4 Multivariate Correlations Calories Calories Suga Fiber -0.7150 Sugar Fiber 0.7150 -0.5026 1.0000 -0.5028 The correlations are estimated by Row-wise method. Scatterplot Matrix 180 140 120 Calories Sugar Fiber 40 e NO 100 130 140 10 Sugar vs. Calories Group X Wra 15.0 - 12.5 10.0 Sugar Group Y 7.5 5.0 2.5 0.0 .. 60 80 120 140 160 40 Map Shape 100 Calories Frec Fiber vs. Calories Group X Wra 15.0 12.5 10.0 Fiber 7.5 Group Y 5.0 .. 2.5 0.0 T 160 60 80 120 140 40 Map Shape 100 Calories Fre Fiber vs. Sugar Group X Wrap 15.0 12.5 - 10.0 Fiber 7.5 Group Y 5.0 2.5 - 0.0-O 2.5 5.0 10.0 12.5 15.0 0.0 Map Shape 7.5 Sugar Fre
Step by Step Solution
There are 3 Steps involved in it

Get step-by-step solutions from verified subject matter experts