

Question: I only need the answer to D never mind D belongs to a different question :/ Problems 4.1-4.42 relate to Time-Series Forecasting 4.1 The following
I only need the answer to D 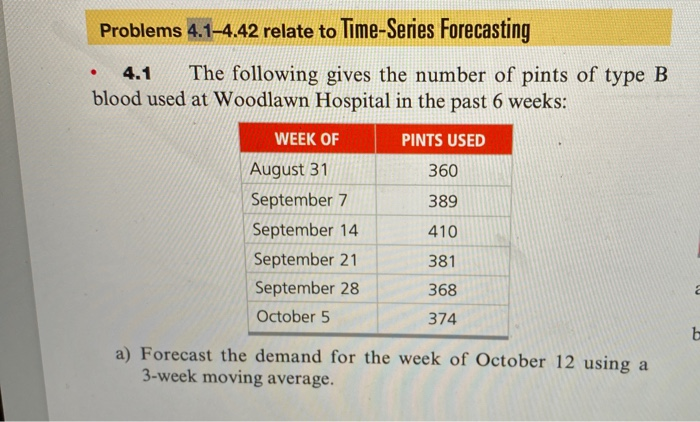
never mind D belongs to a different question :/
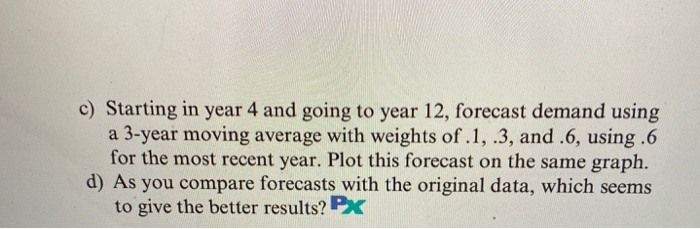
Problems 4.1-4.42 relate to Time-Series Forecasting 4.1 The following gives the number of pints of type B blood used at Woodlawn Hospital in the past 6 weeks: WEEK OF August 31 September 7 September 14 September 21 September 28 October 5 PINTS USED 360 389 410 381 368 374 a) Forecast the demand for the week of October 12 using a 3-week moving average. c) Starting in year 4 and going to year 12, forecast demand using a 3-year moving average with weights of .1,.3, and .6, using .6 for the most recent year. Plot this forecast on the same graph. d) As you compare forecasts with the original data, which seems to give the better results? PX Problems 4.1-4.42 relate to Time-Series Forecasting 4.1 The following gives the number of pints of type B blood used at Woodlawn Hospital in the past 6 weeks: WEEK OF August 31 September 7 September 14 September 21 September 28 October 5 PINTS USED 360 389 410 381 368 374 a) Forecast the demand for the week of October 12 using a 3-week moving average. c) Starting in year 4 and going to year 12, forecast demand using a 3-year moving average with weights of .1,.3, and .6, using .6 for the most recent year. Plot this forecast on the same graph. d) As you compare forecasts with the original data, which seems to give the better results? PX
Step by Step Solution
There are 3 Steps involved in it
1 Expert Approved Answer
Step: 1 Unlock

Question Has Been Solved by an Expert!
Get step-by-step solutions from verified subject matter experts
Step: 2 Unlock
Step: 3 Unlock