

Question: I put D and got it wrong I think the answer is E, but im not sure please help and show all work, thank you!
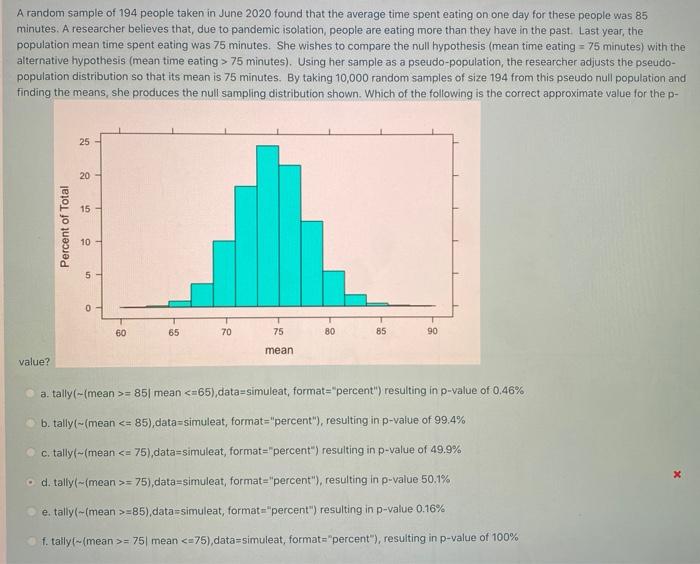
I put D and got it wrong
I think the answer is E, but im not sure
please help and show all work, thank you!
Step by Step Solution
There are 3 Steps involved in it
1 Expert Approved Answer
Step: 1 Unlock

Question Has Been Solved by an Expert!
Get step-by-step solutions from verified subject matter experts
Step: 2 Unlock
Step: 3 Unlock